Security Analytics
Go beyond vulnerability scanning. AuditROI gives you deep analytics across every dimension of the threat landscape — industries, vendors, products, ransomware economics, compliance gaps, and supply chain risk.
Compare any two vendors or products side-by-side. Understand which threat actors target your industry. Map your compliance exposure. Make security decisions backed by data, not guesswork.
Industry Profiles
Vendors Tracked
Products Profiled
Ransomware Groups
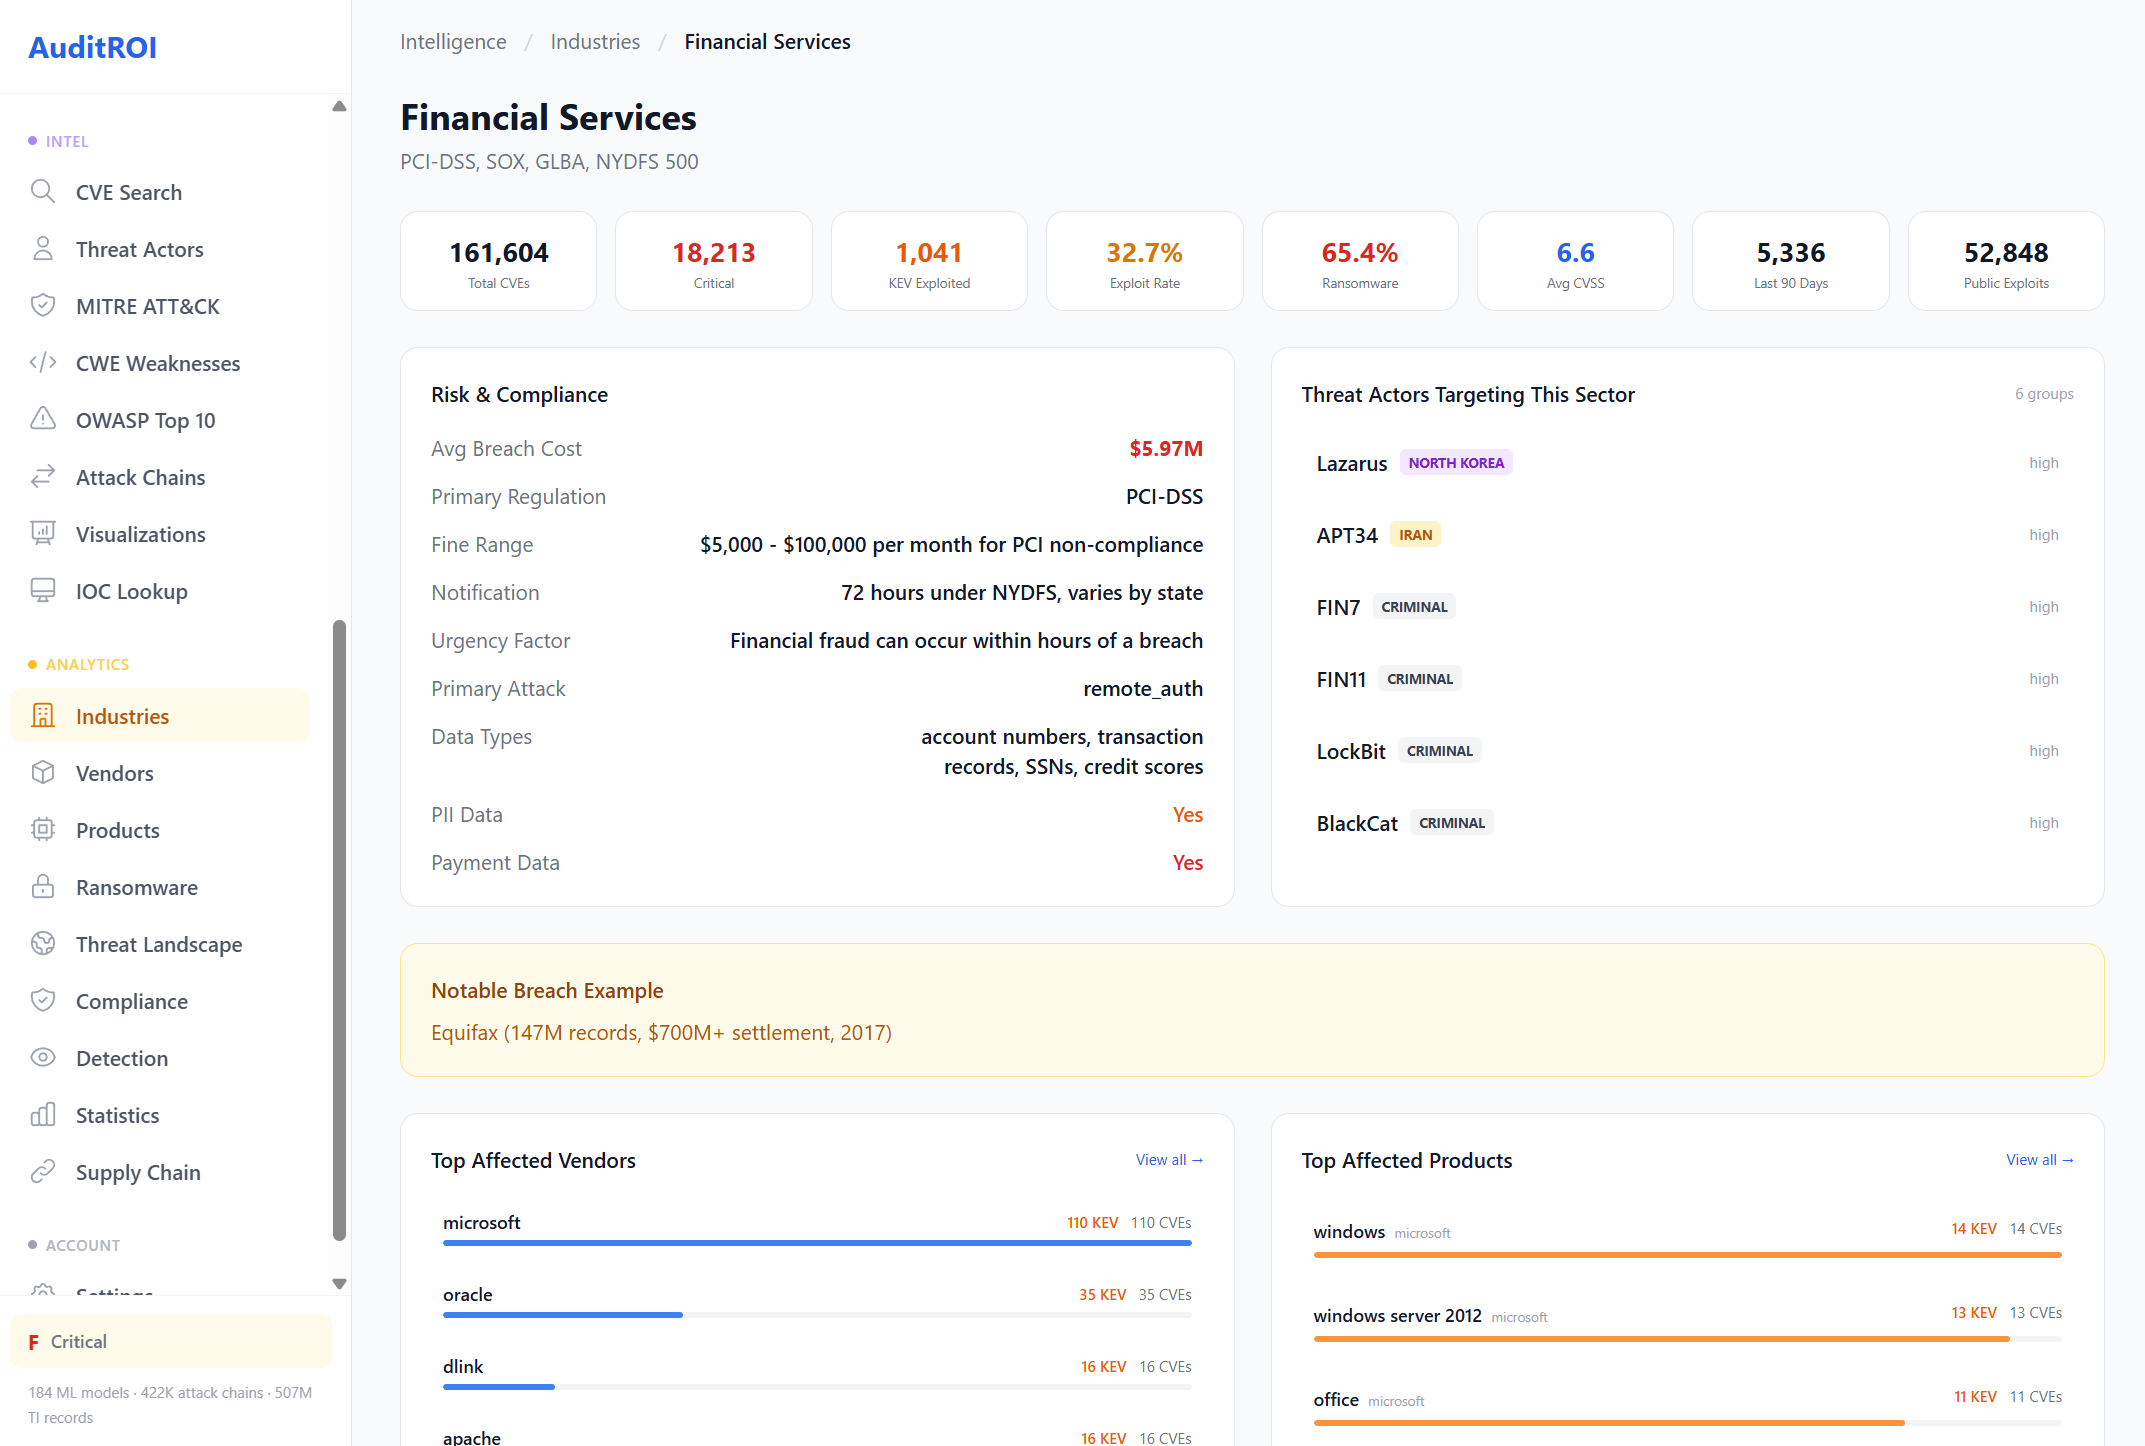
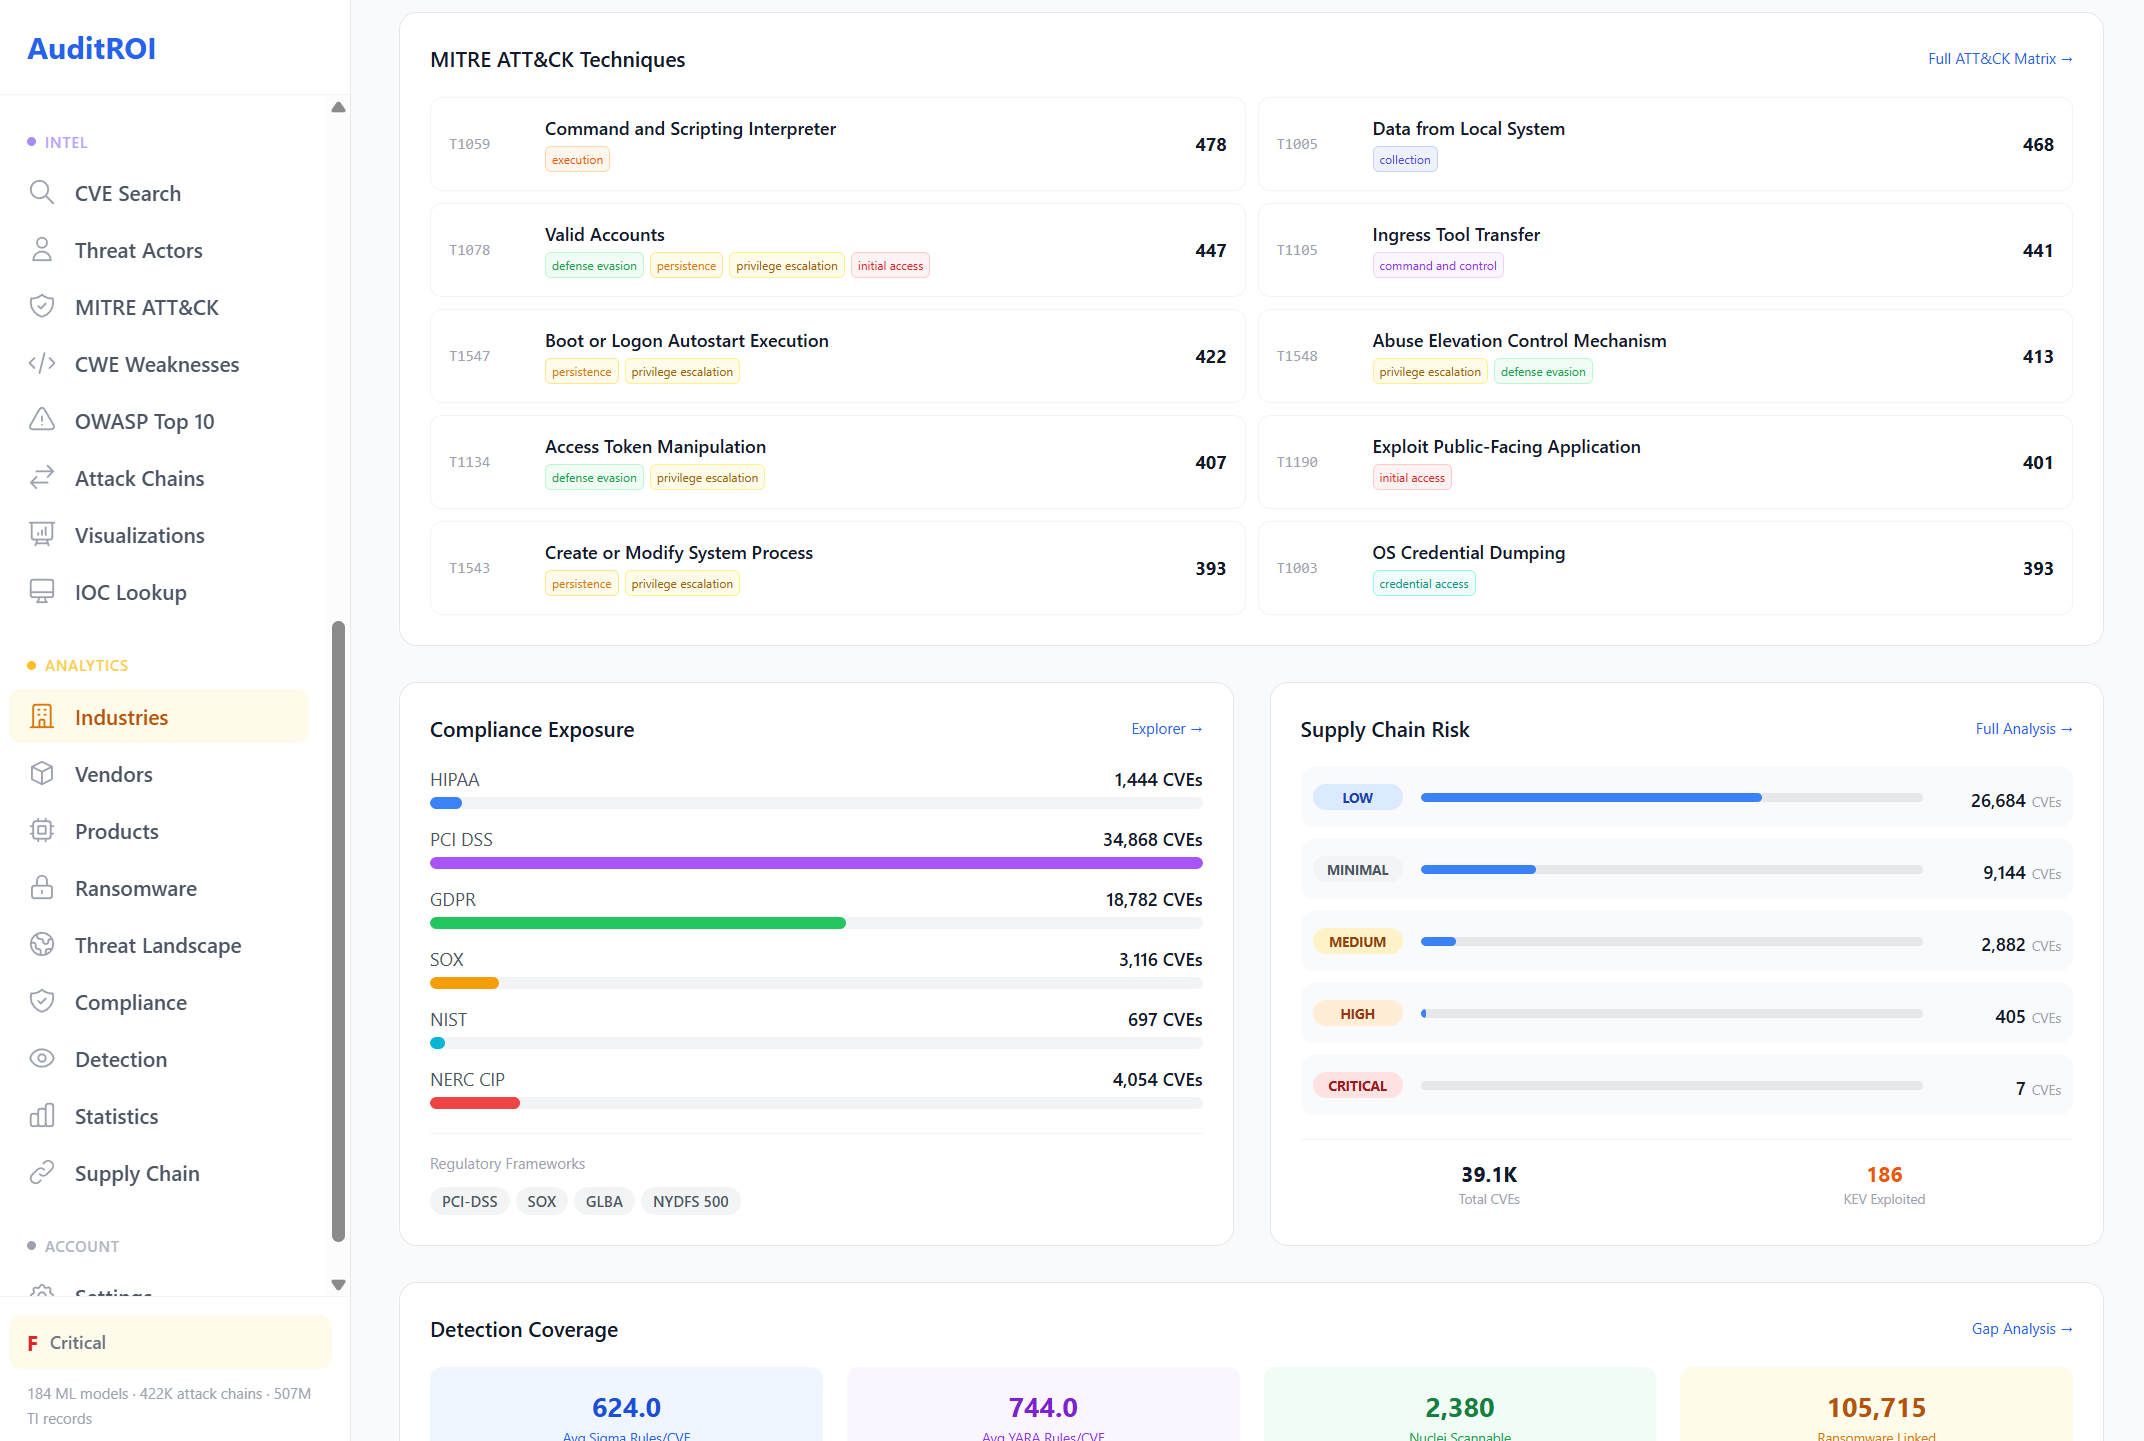
Industry Intelligence
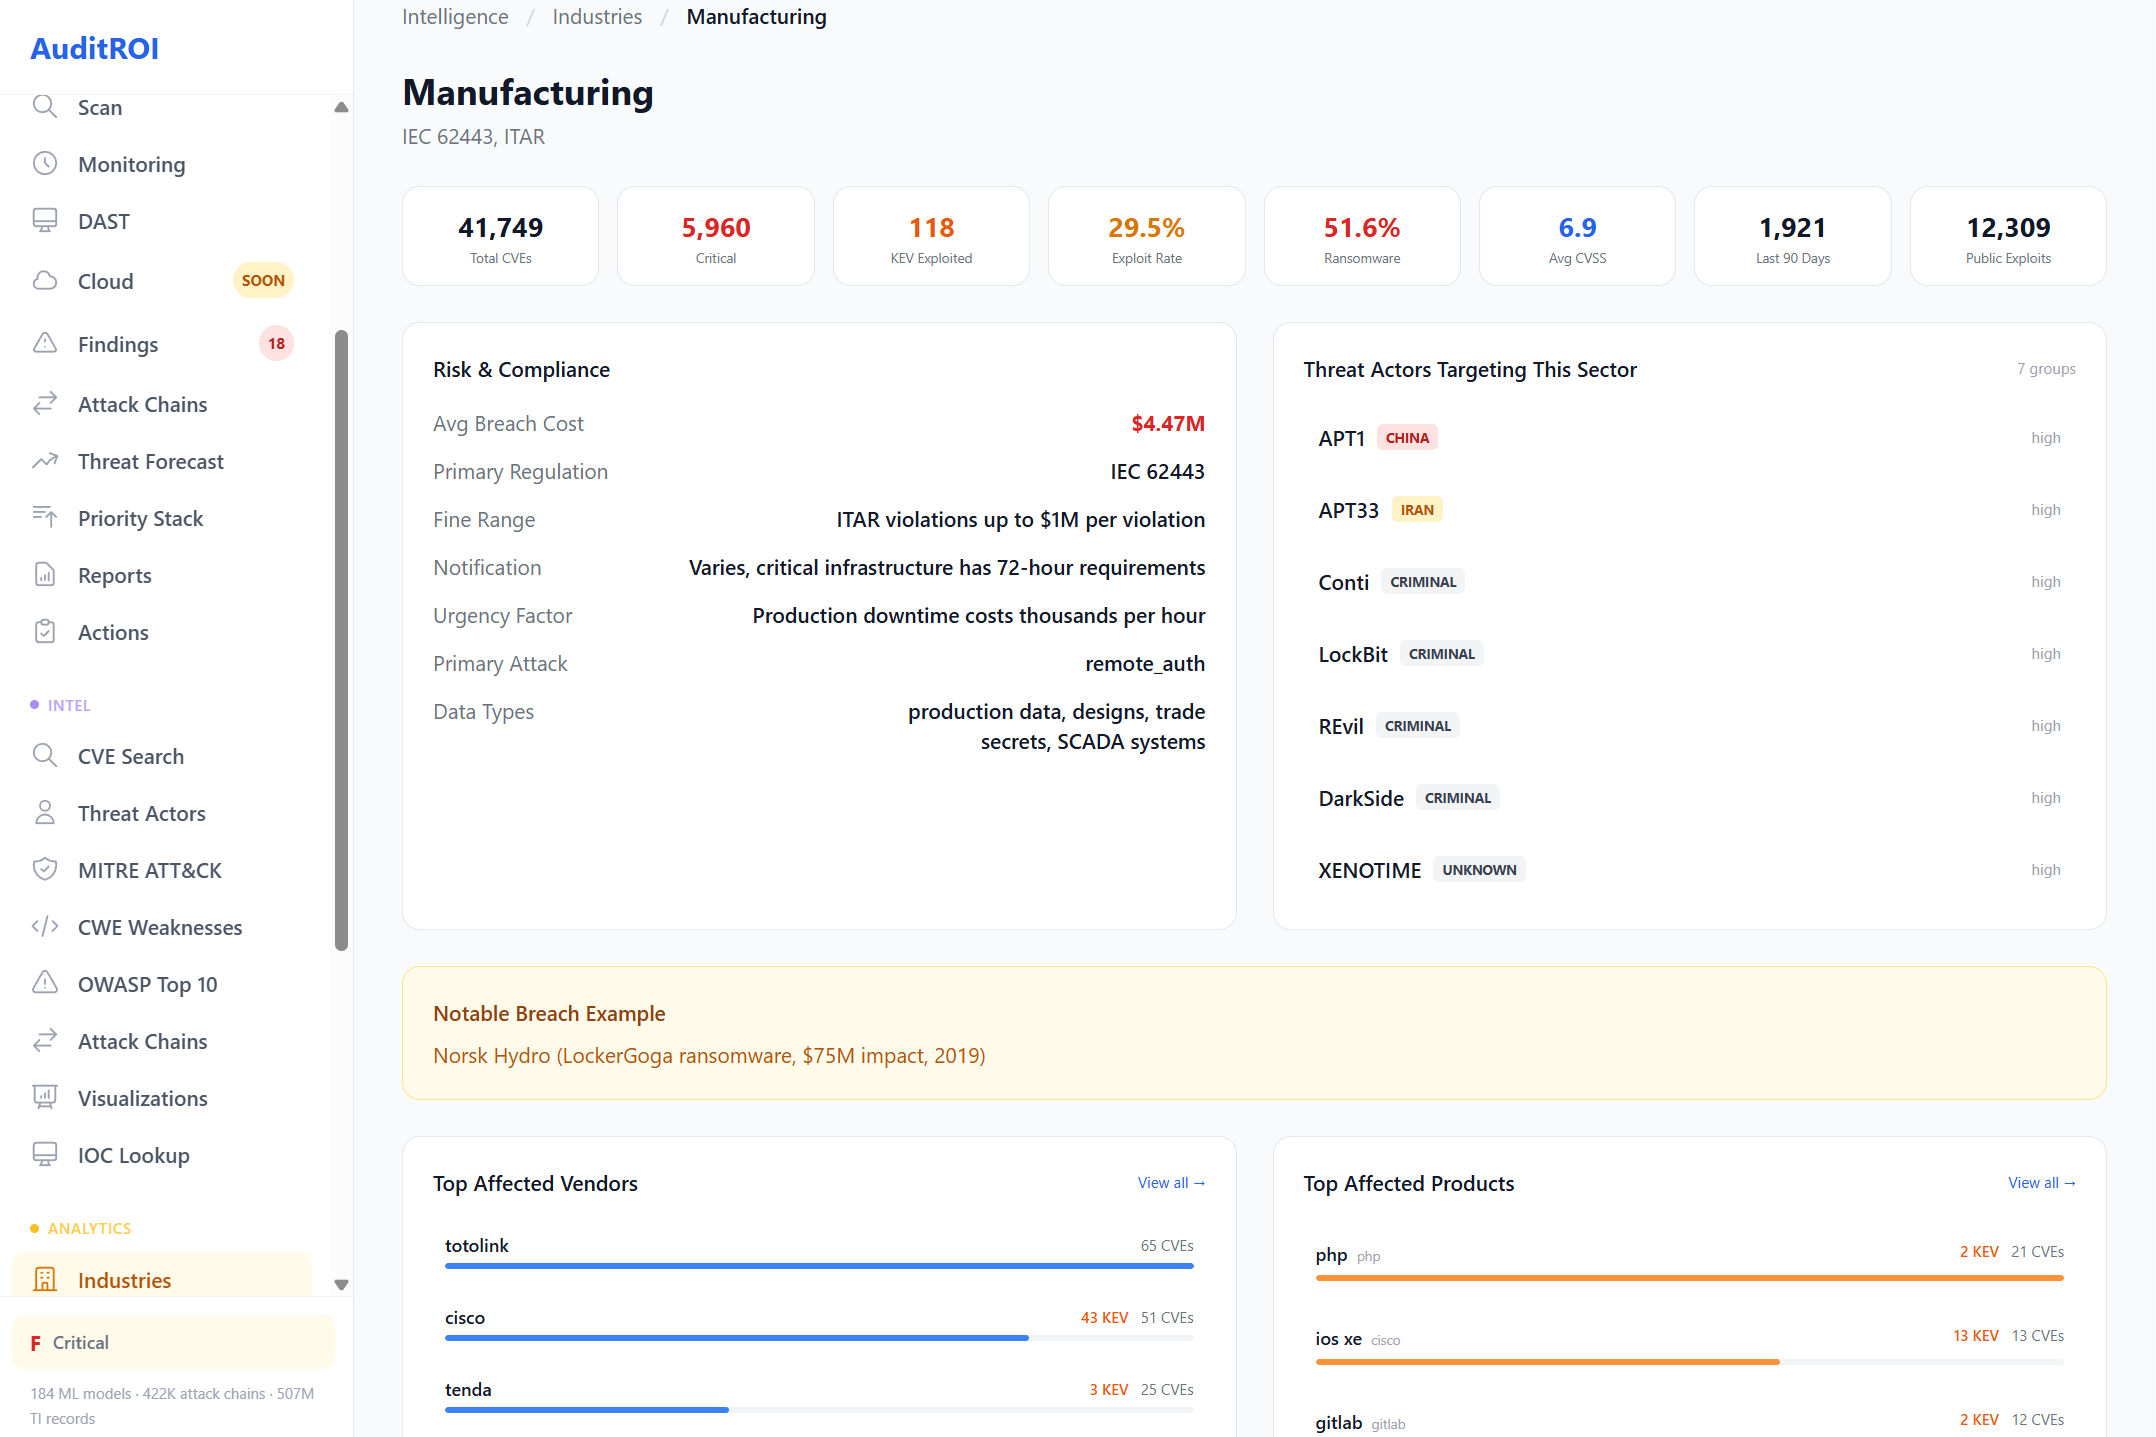
Every industry faces different threats. Financial services deals with Lazarus and FIN7. Healthcare faces ransomware targeting patient records. Manufacturing contends with ICS-focused APTs and ITAR compliance.
We profile 17 industries with average breach costs, regulatory requirements, top affected vendors and products, and the specific threat actors known to target each sector.
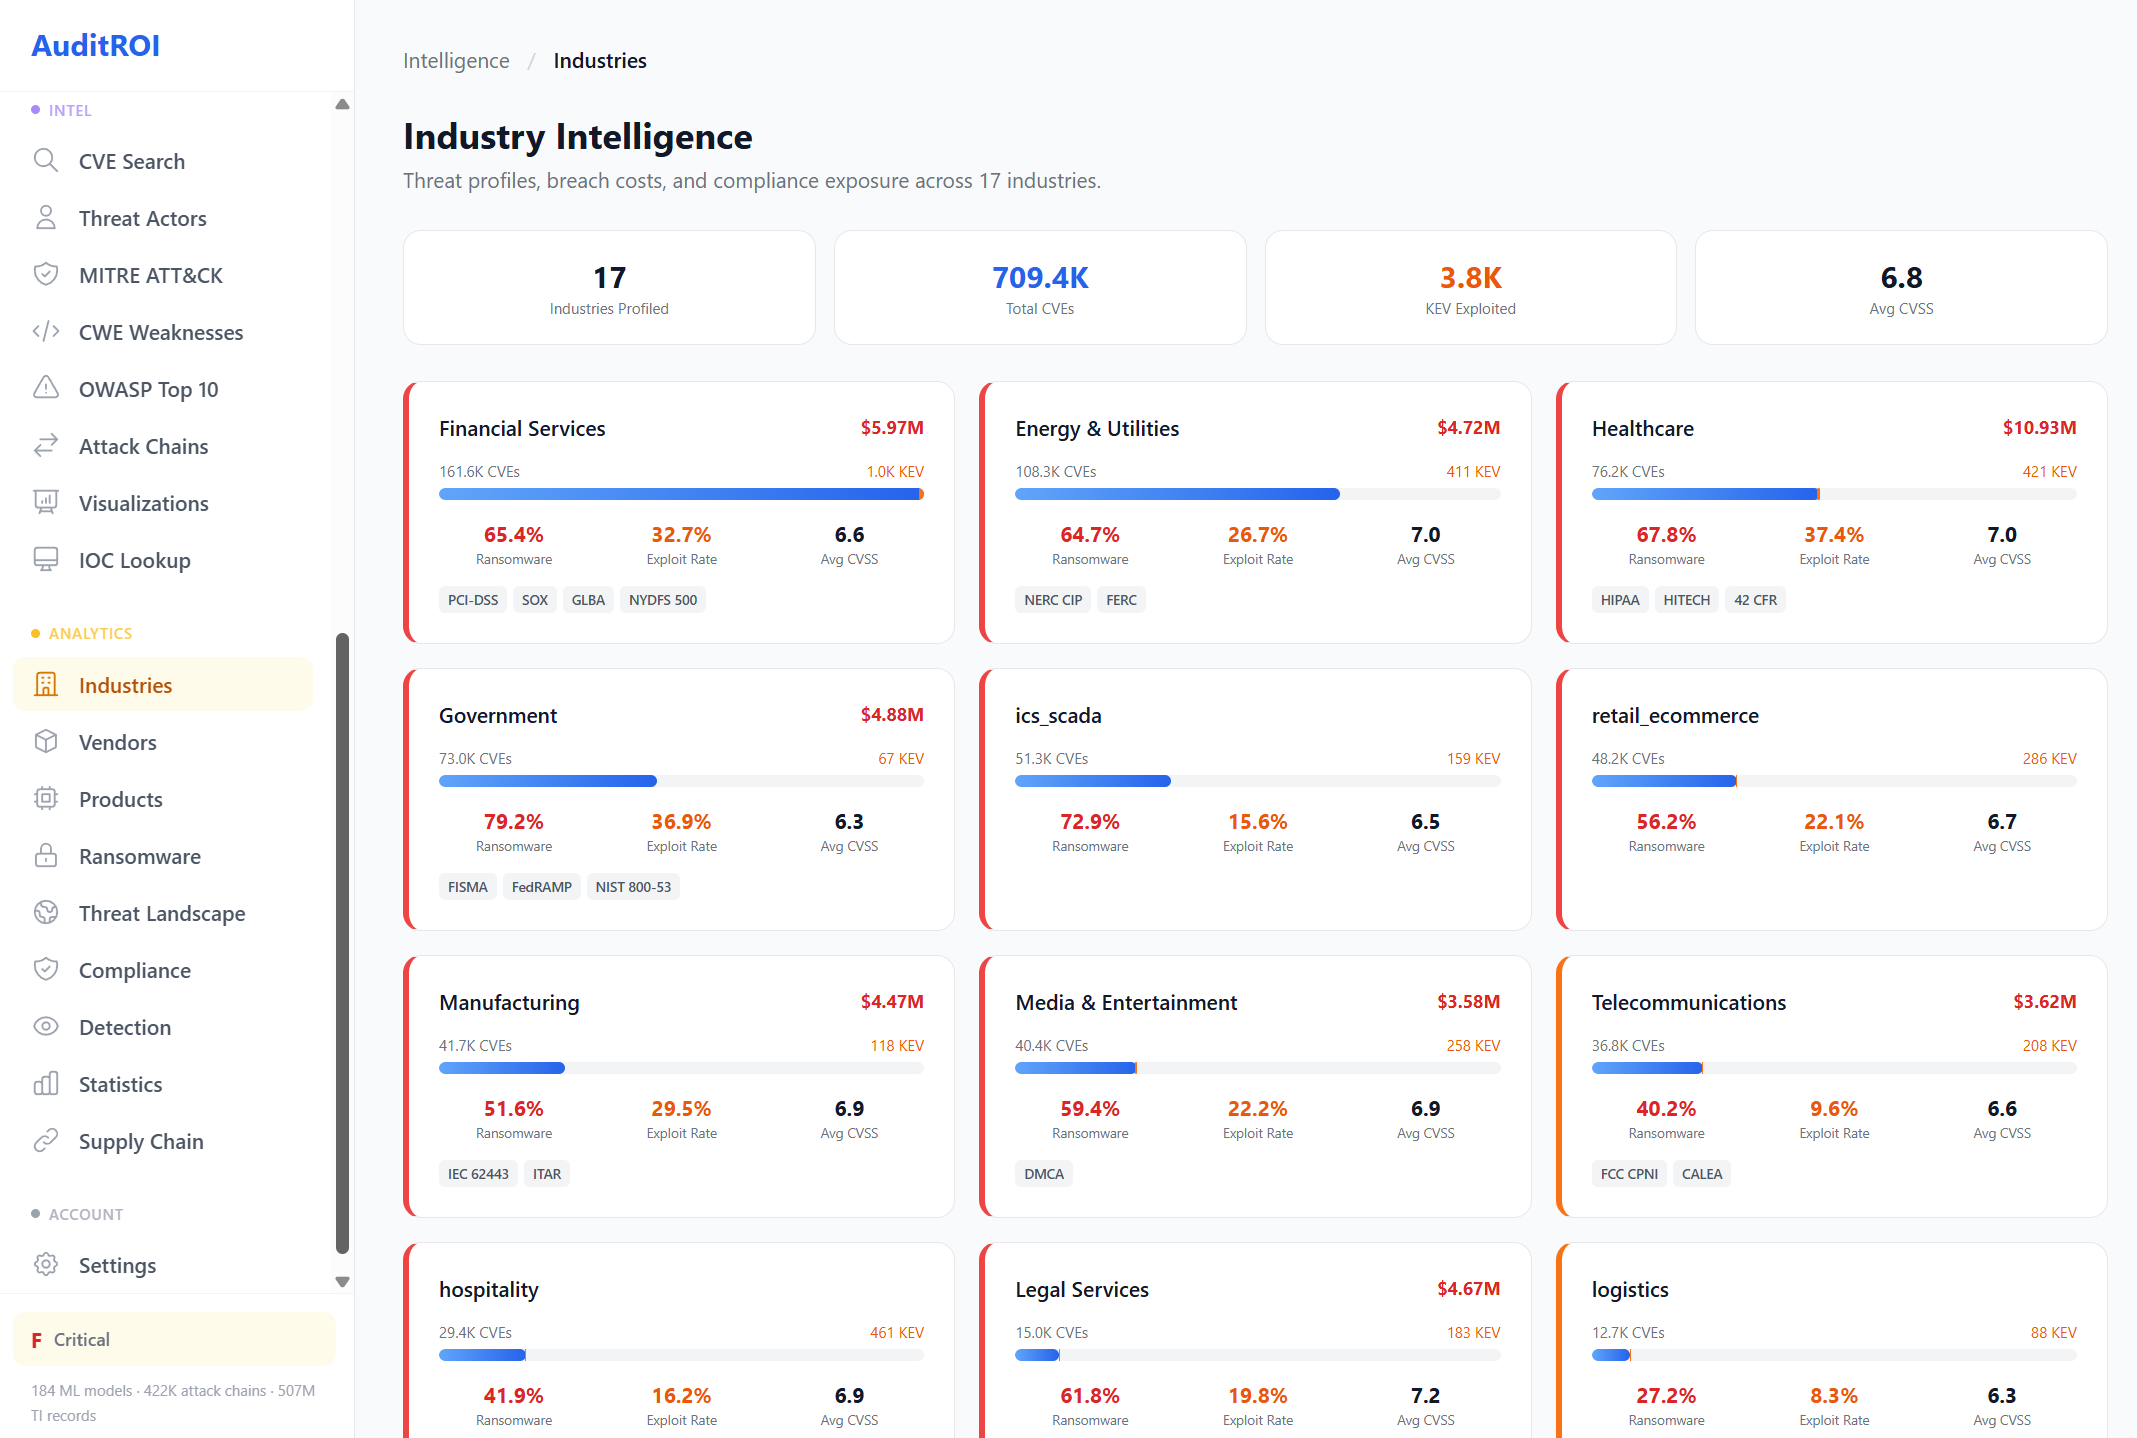
Click any image to enlarge. Example: Financial Services deep-dive.

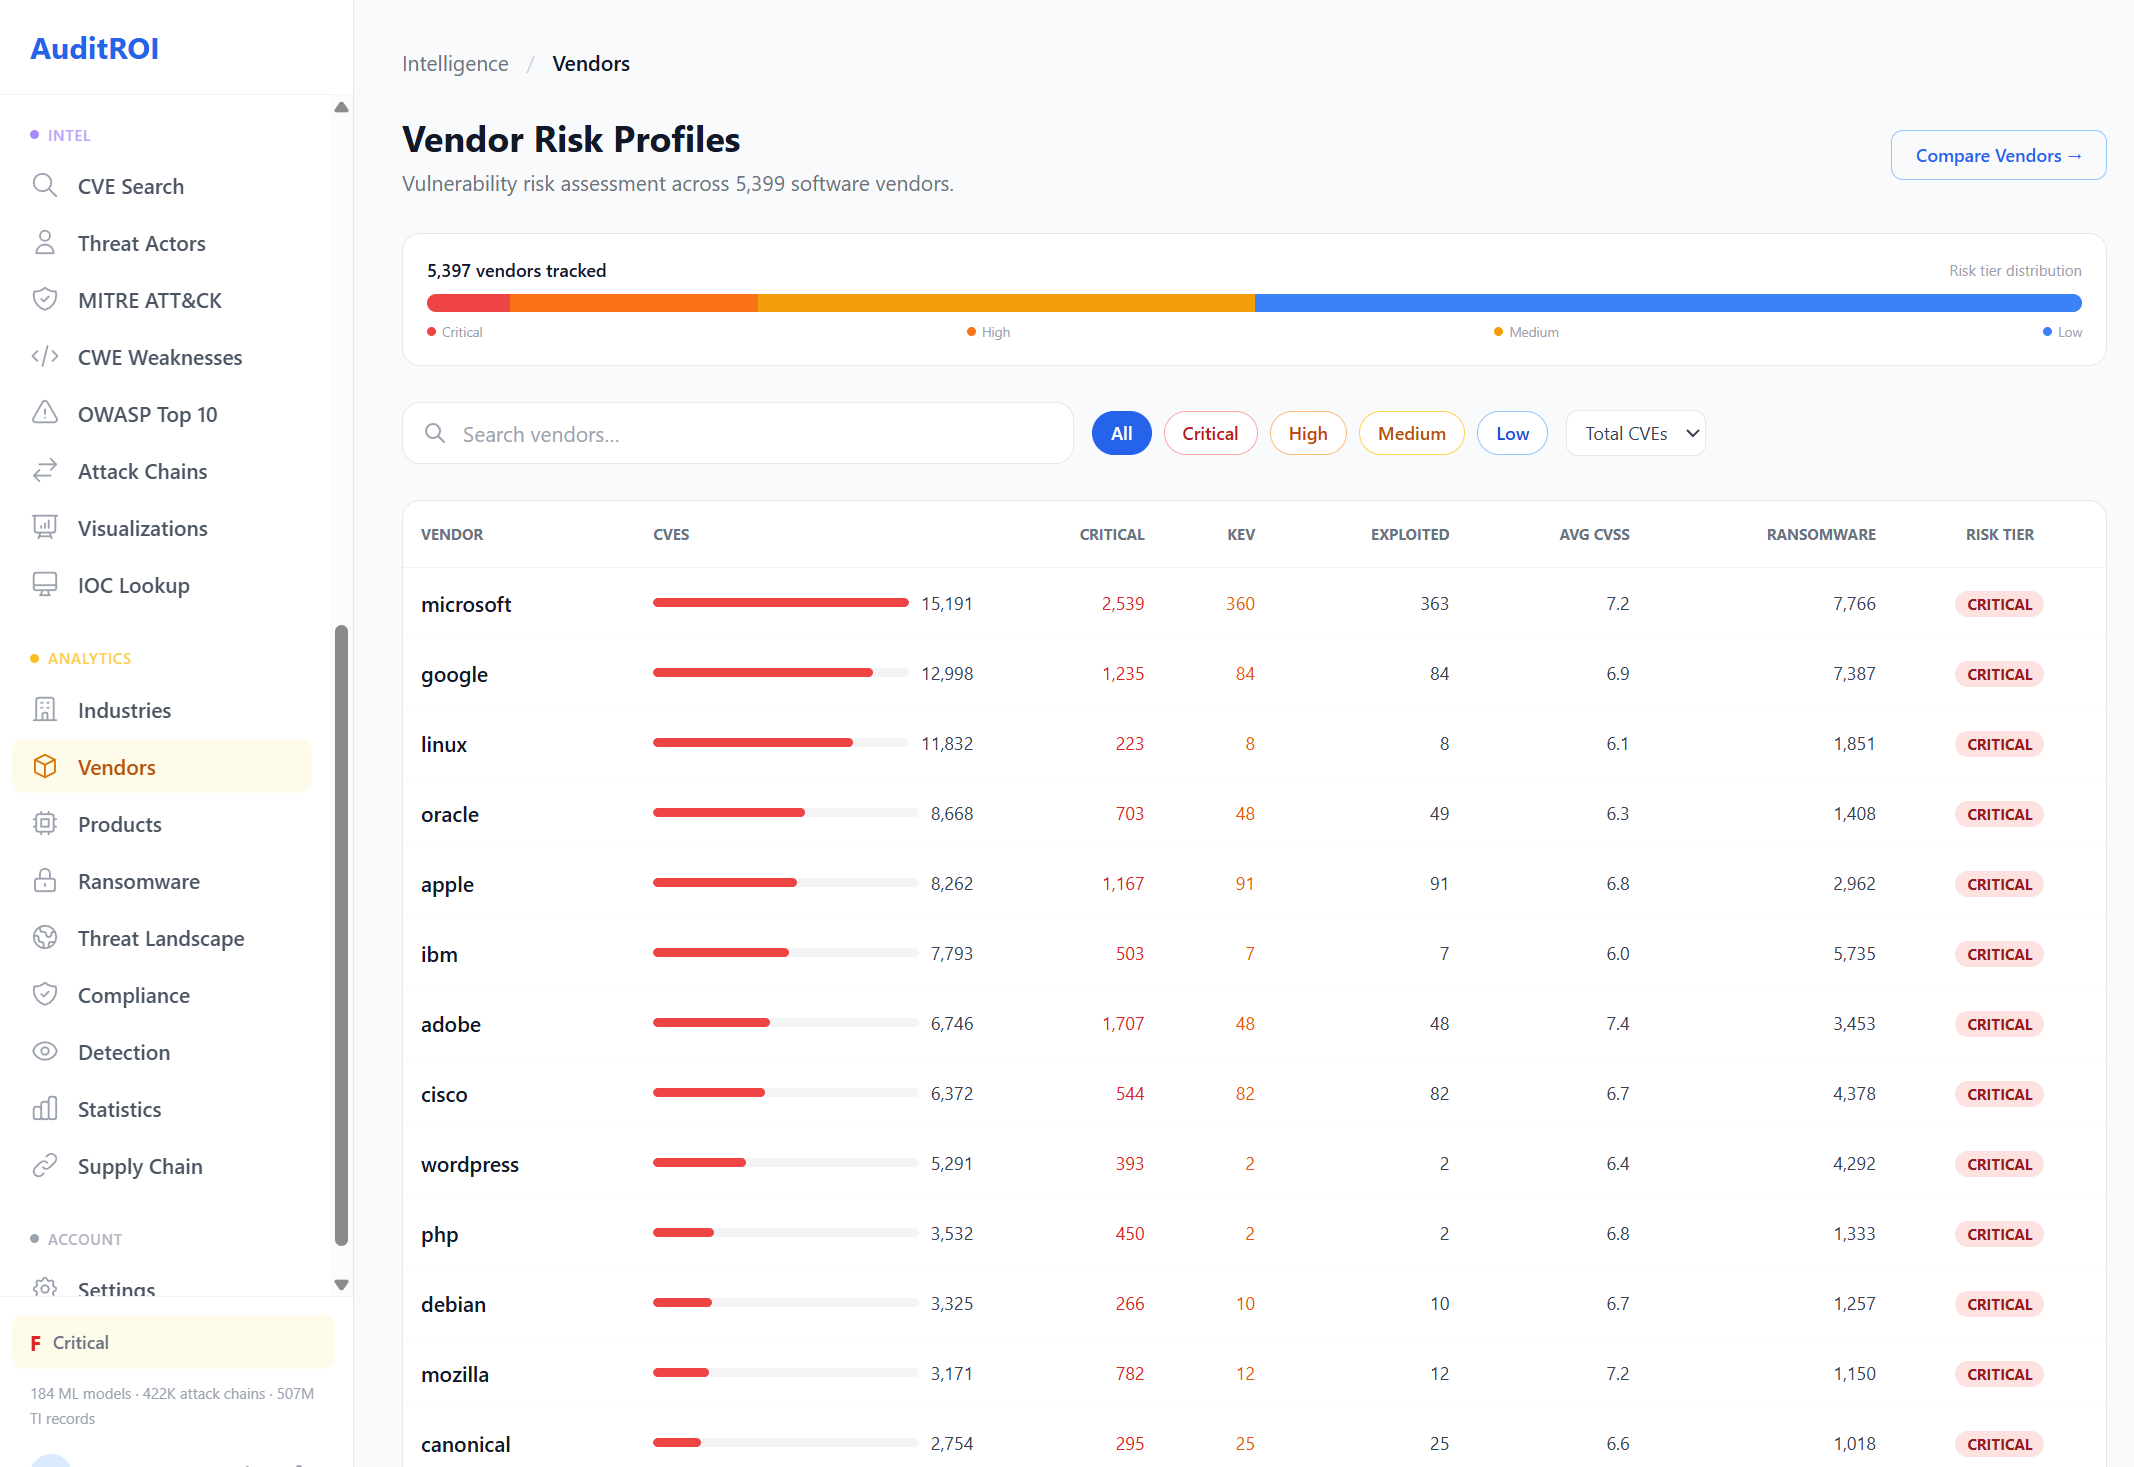
Vendor Risk Profiles
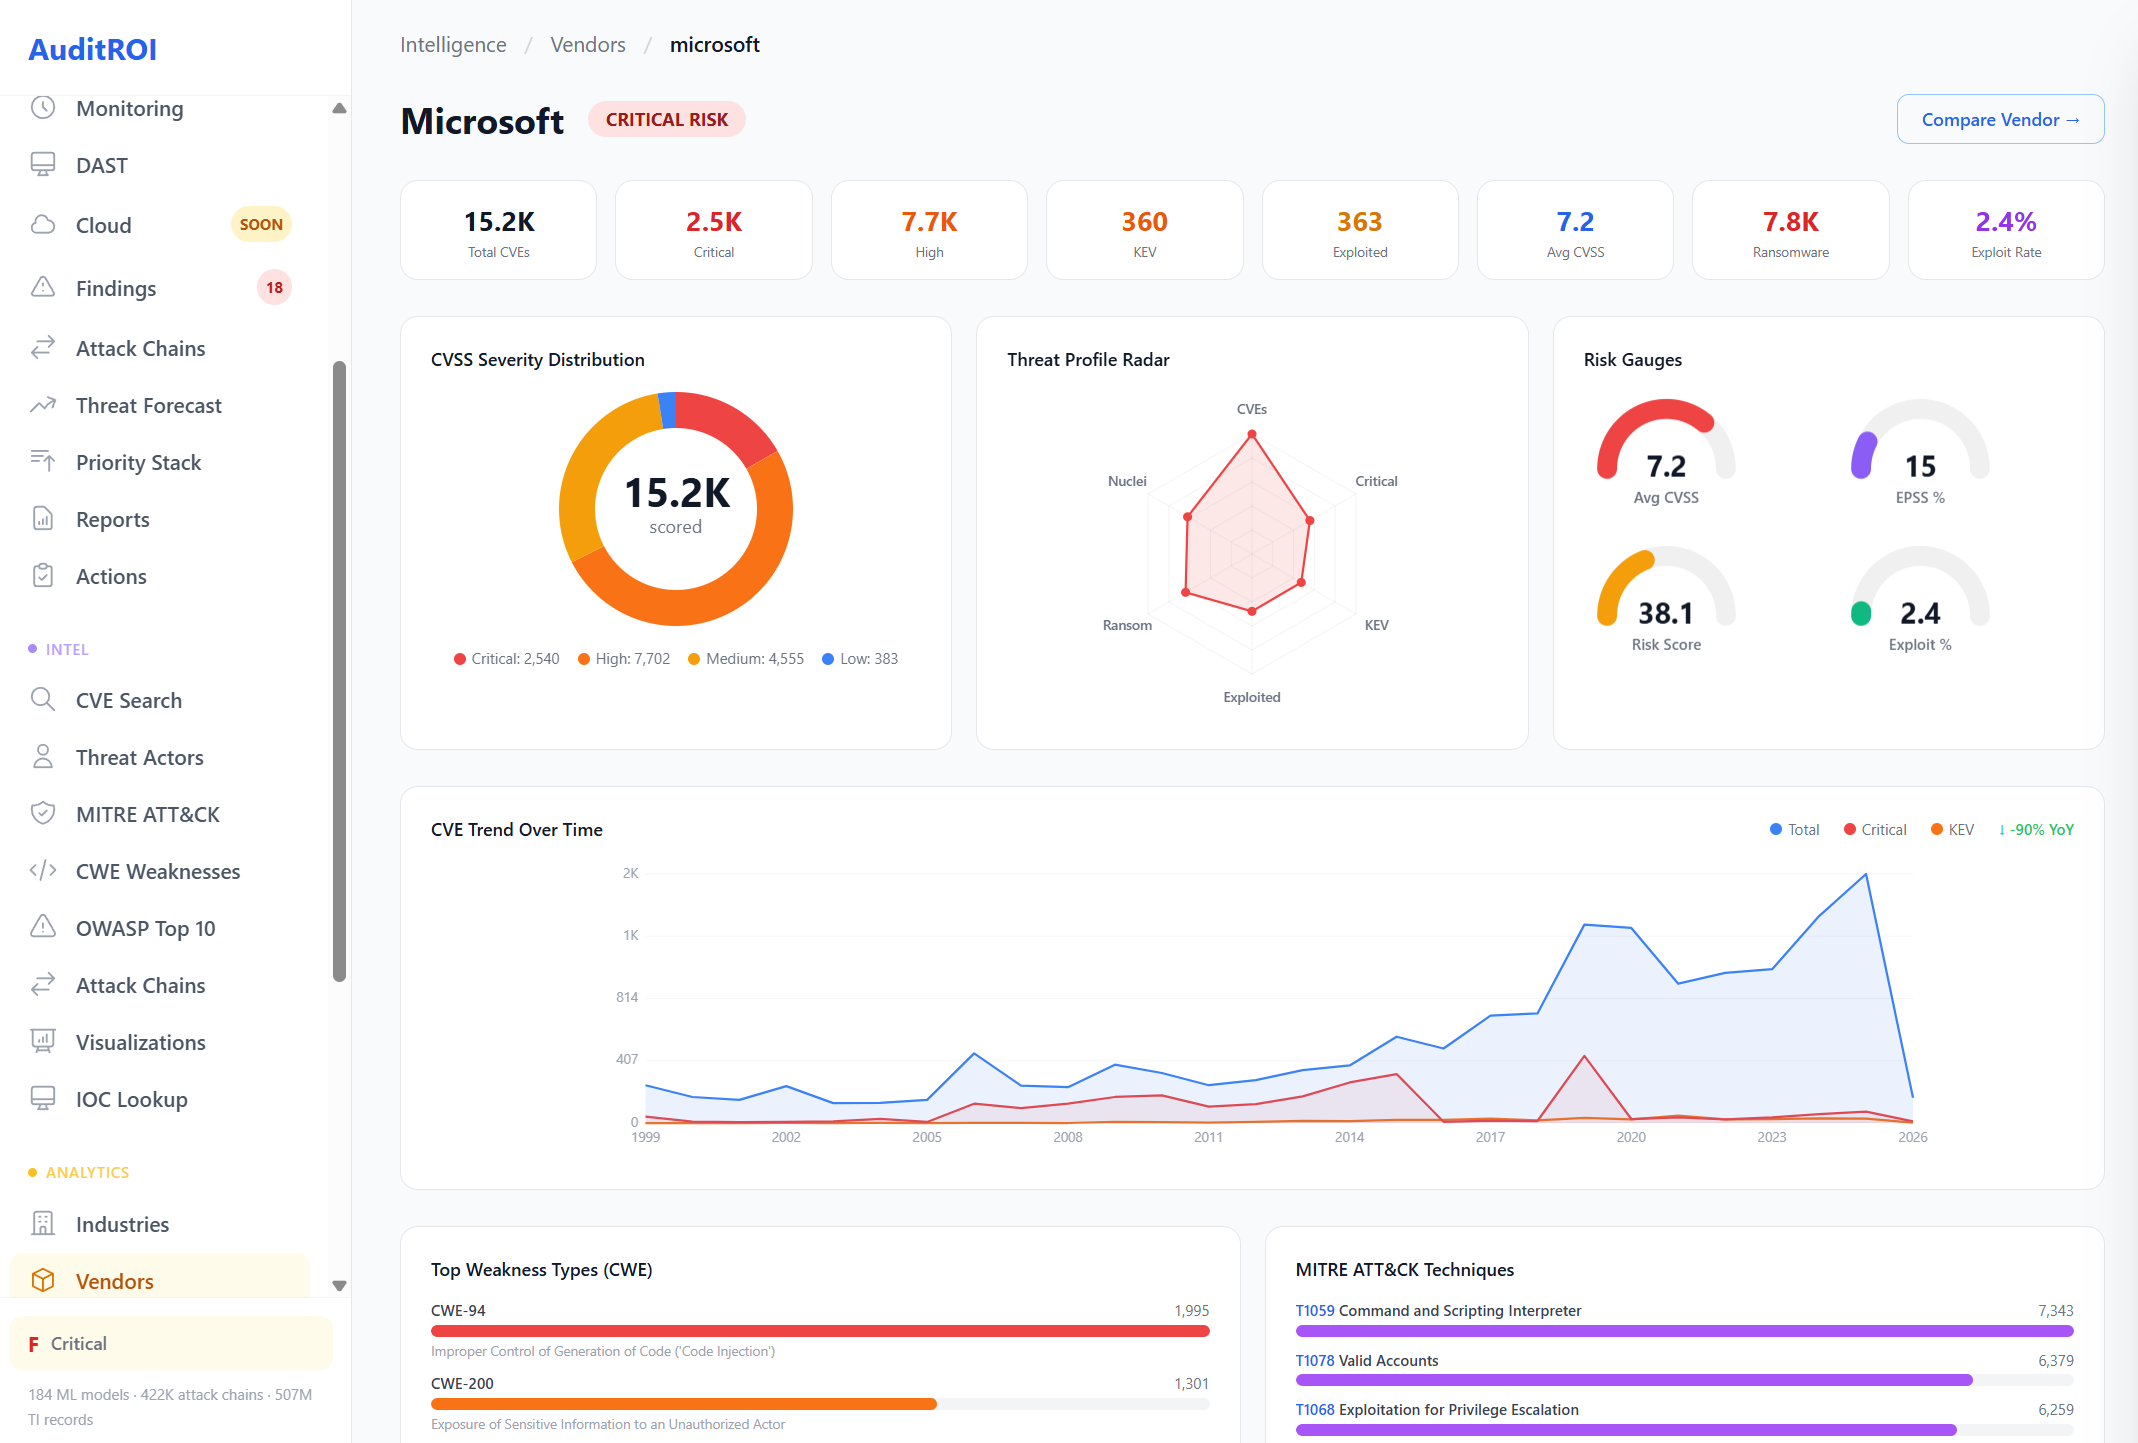
Before adopting any software vendor, understand their vulnerability history. We track 5,399 vendors with CVSS severity distribution, threat profile radar, risk gauges, and CVE trends over time.
Each vendor profile includes cross-industry impact analysis, regulatory compliance exposure, top weakness types (CWE), MITRE ATT&CK technique coverage, and a full product-level breakdown. Know the risk before you sign the contract.
Example: Microsoft vendor profile across three detail views.


Compare Any Two Vendors
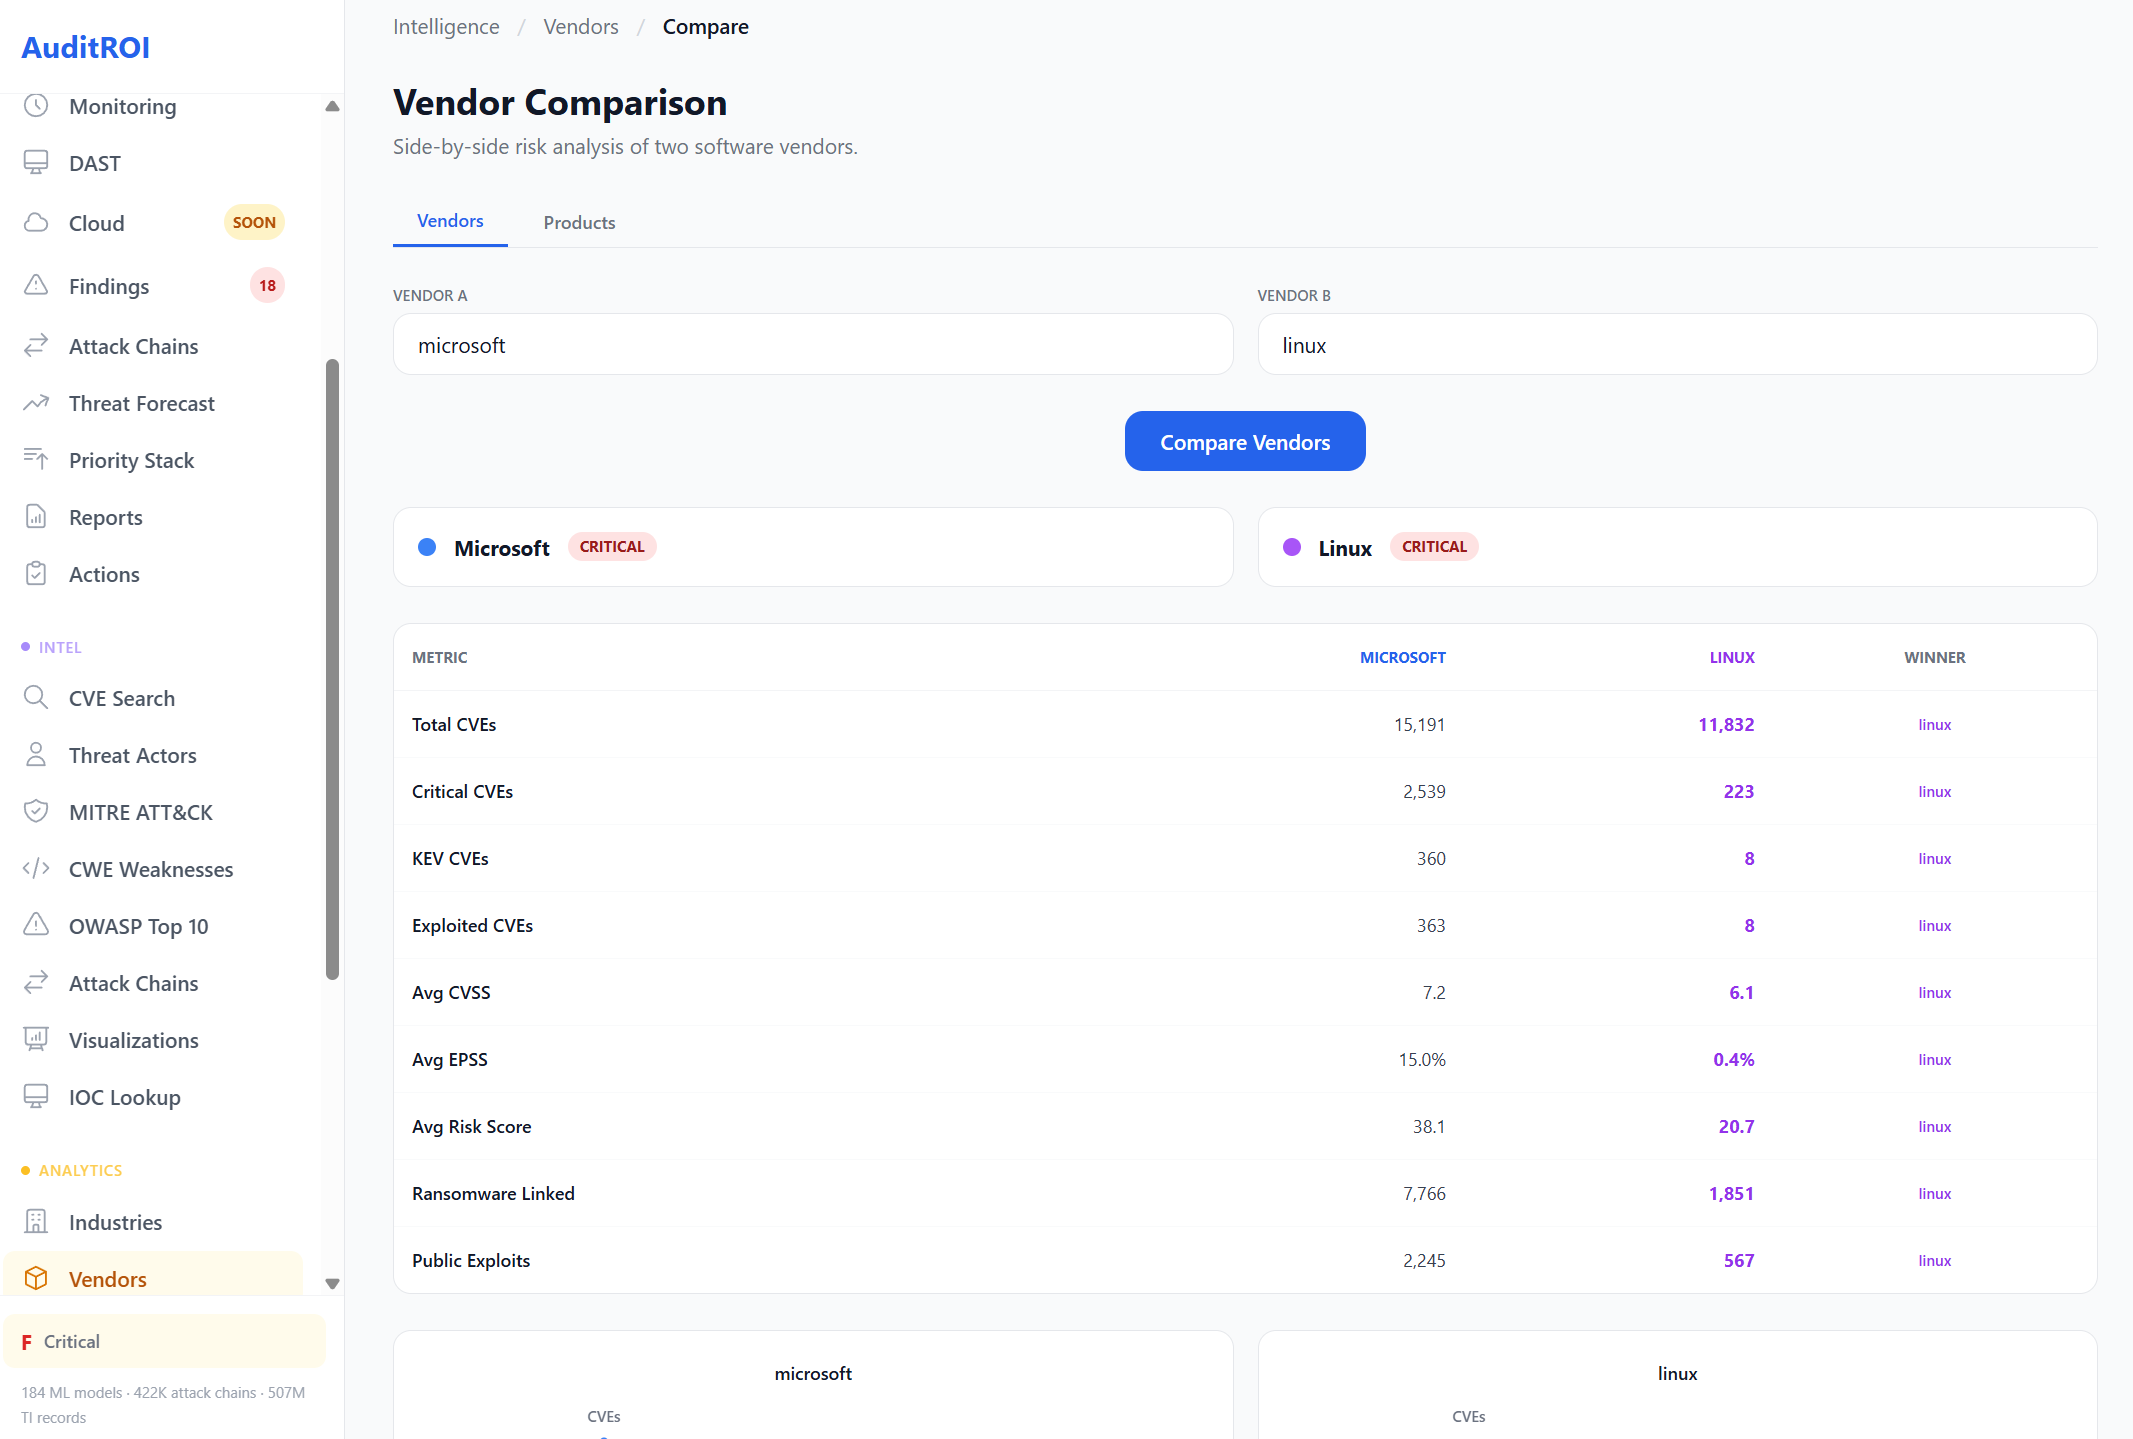
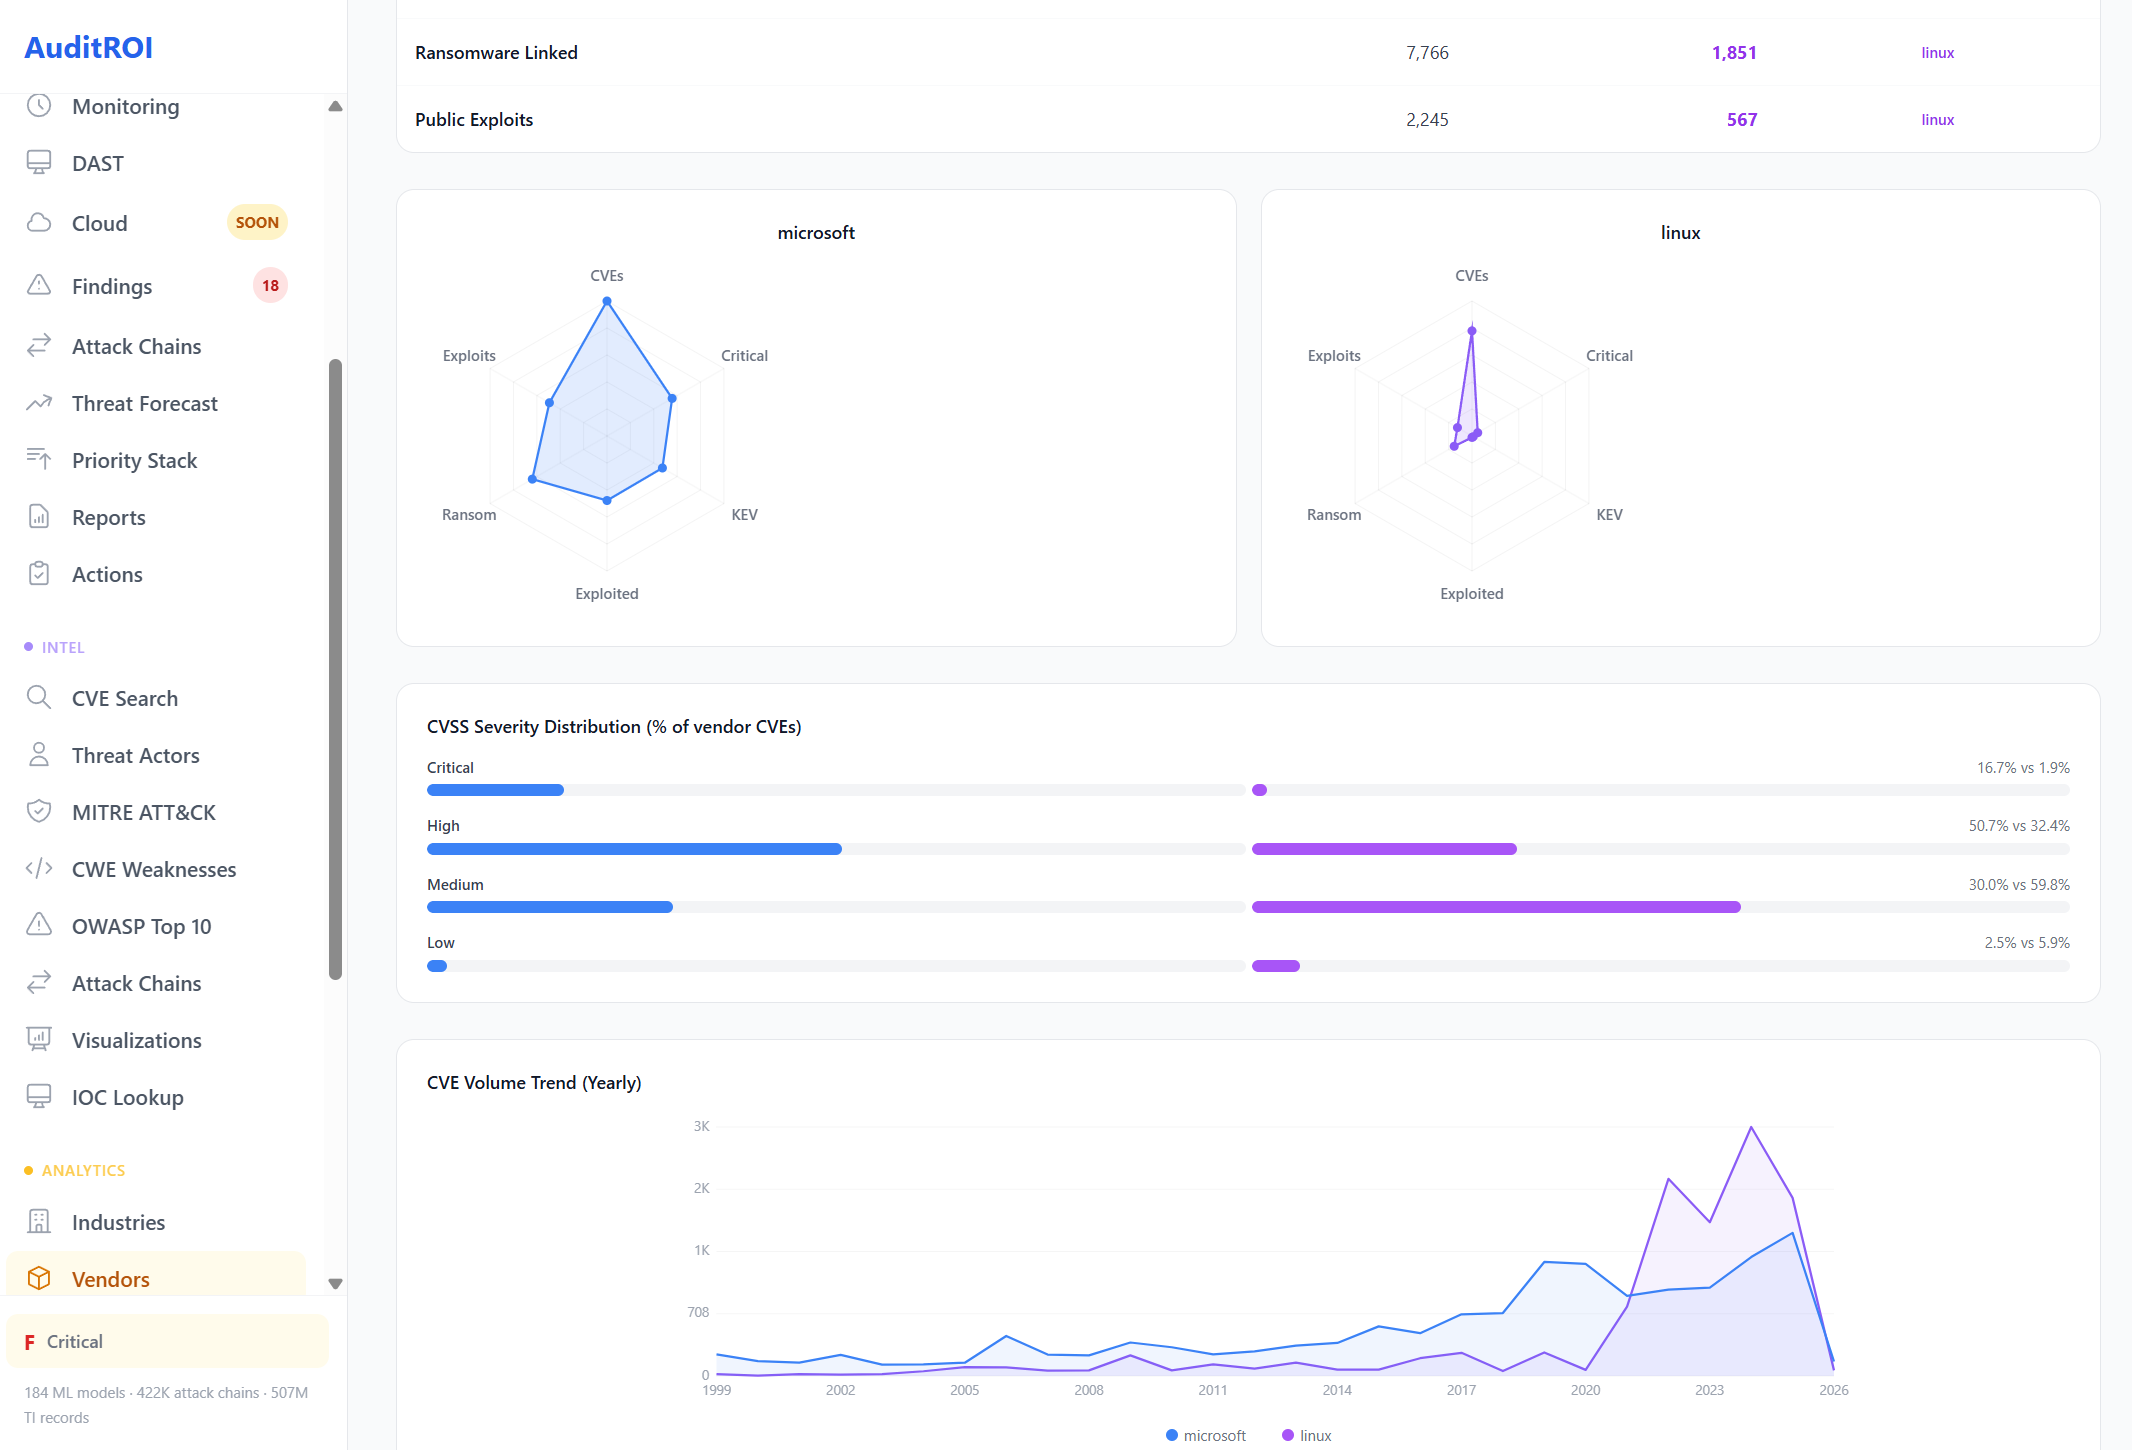
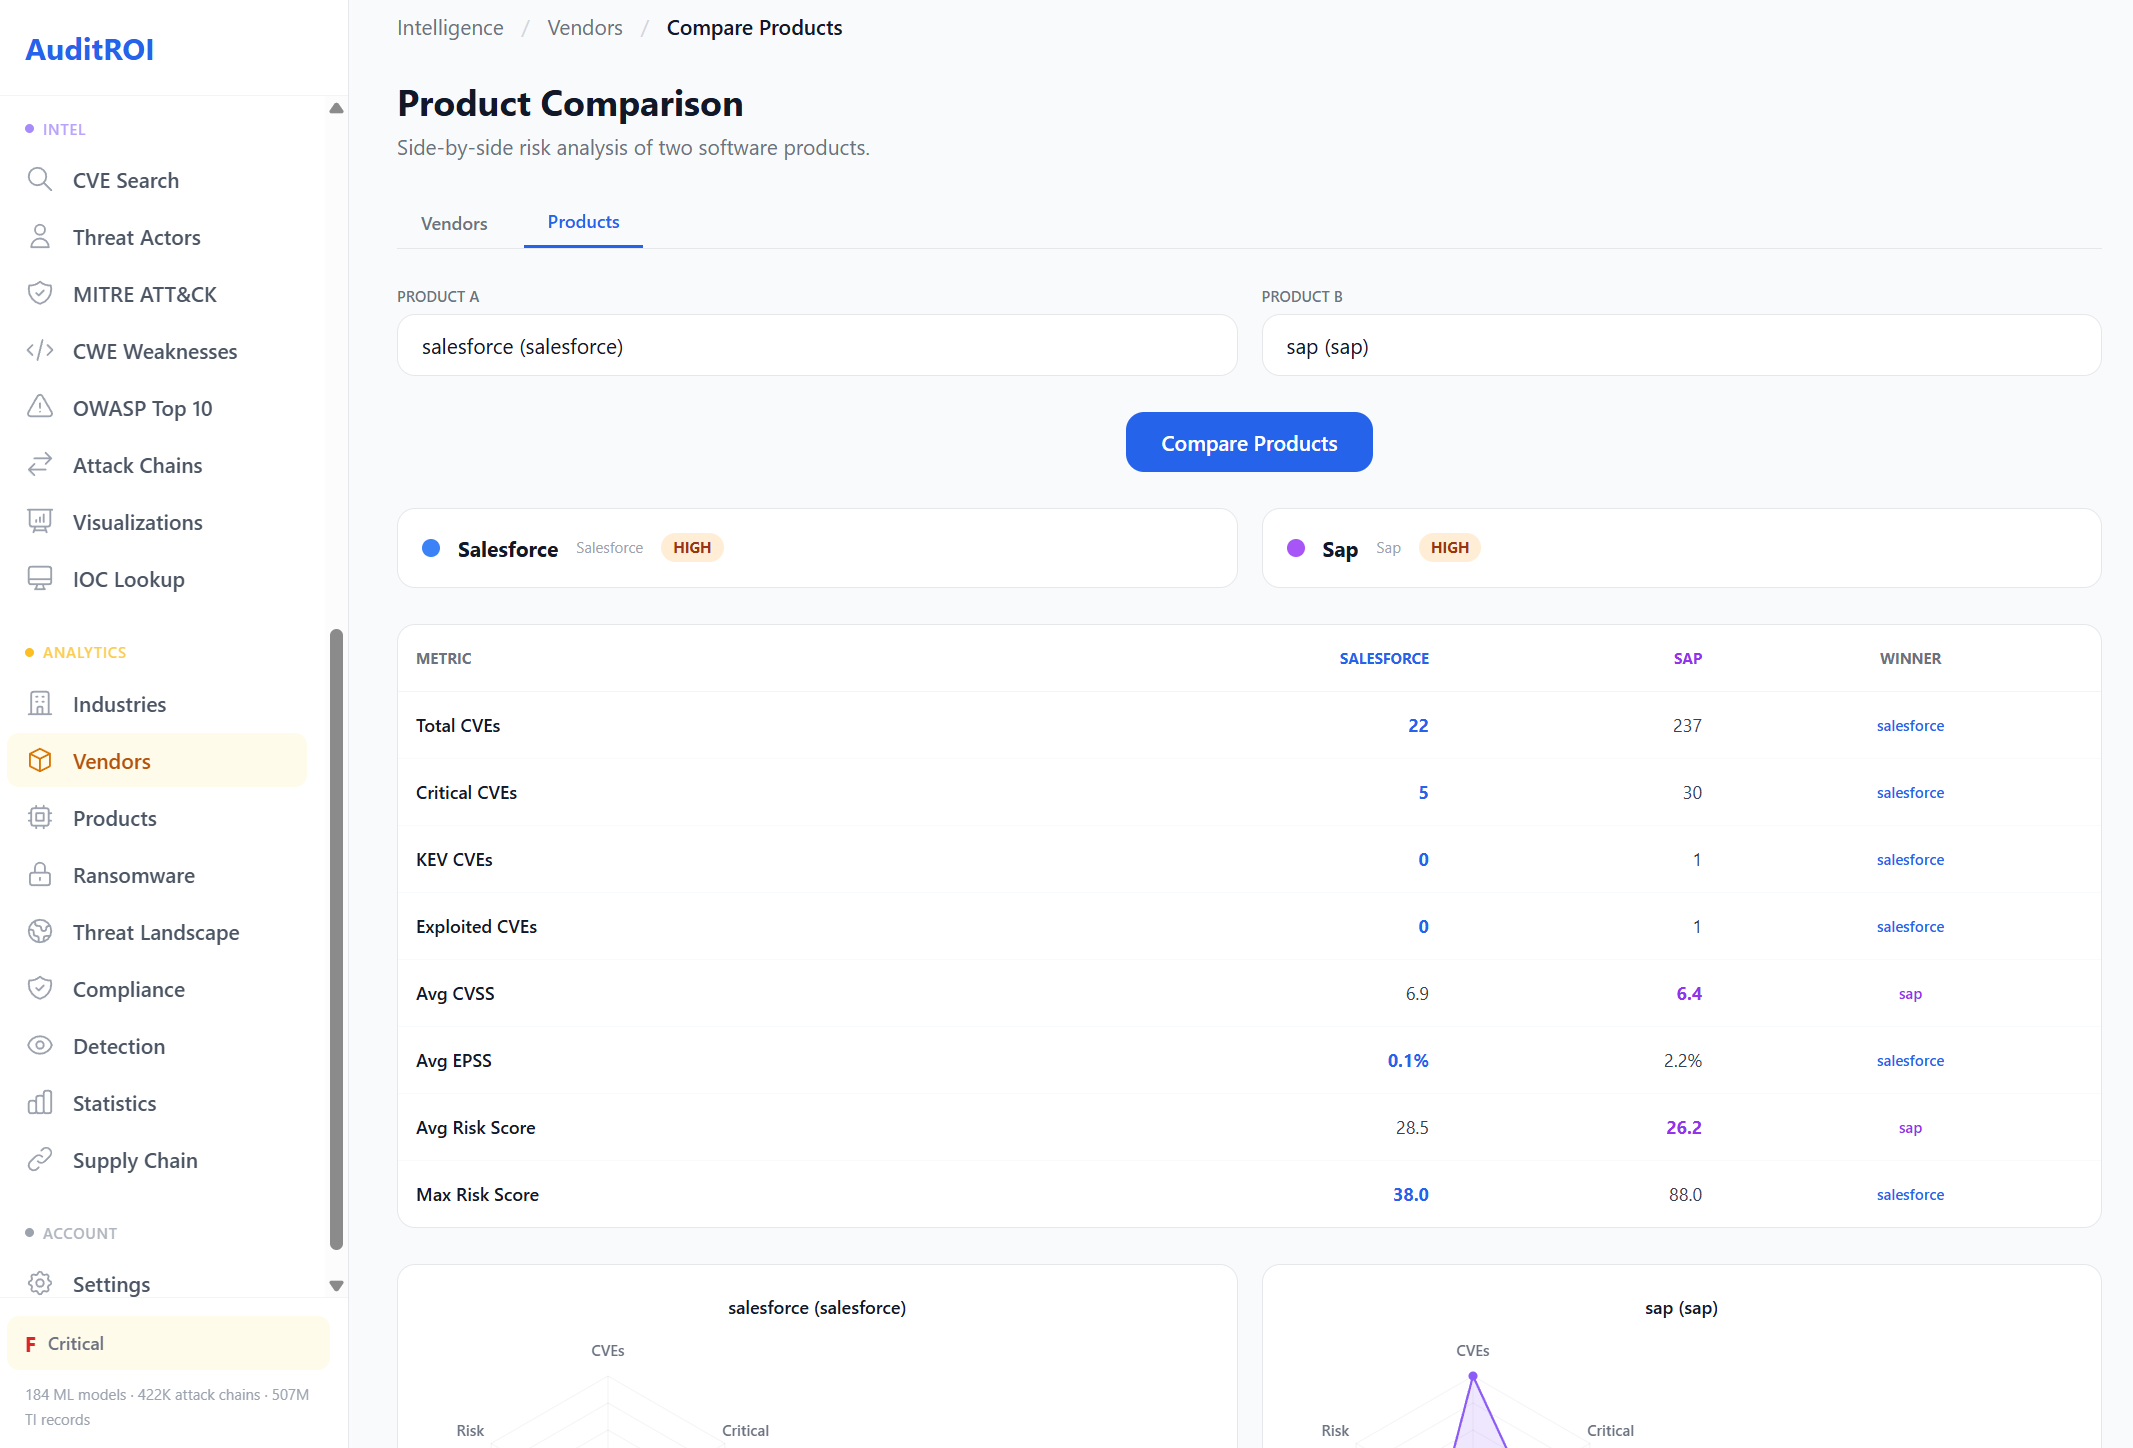
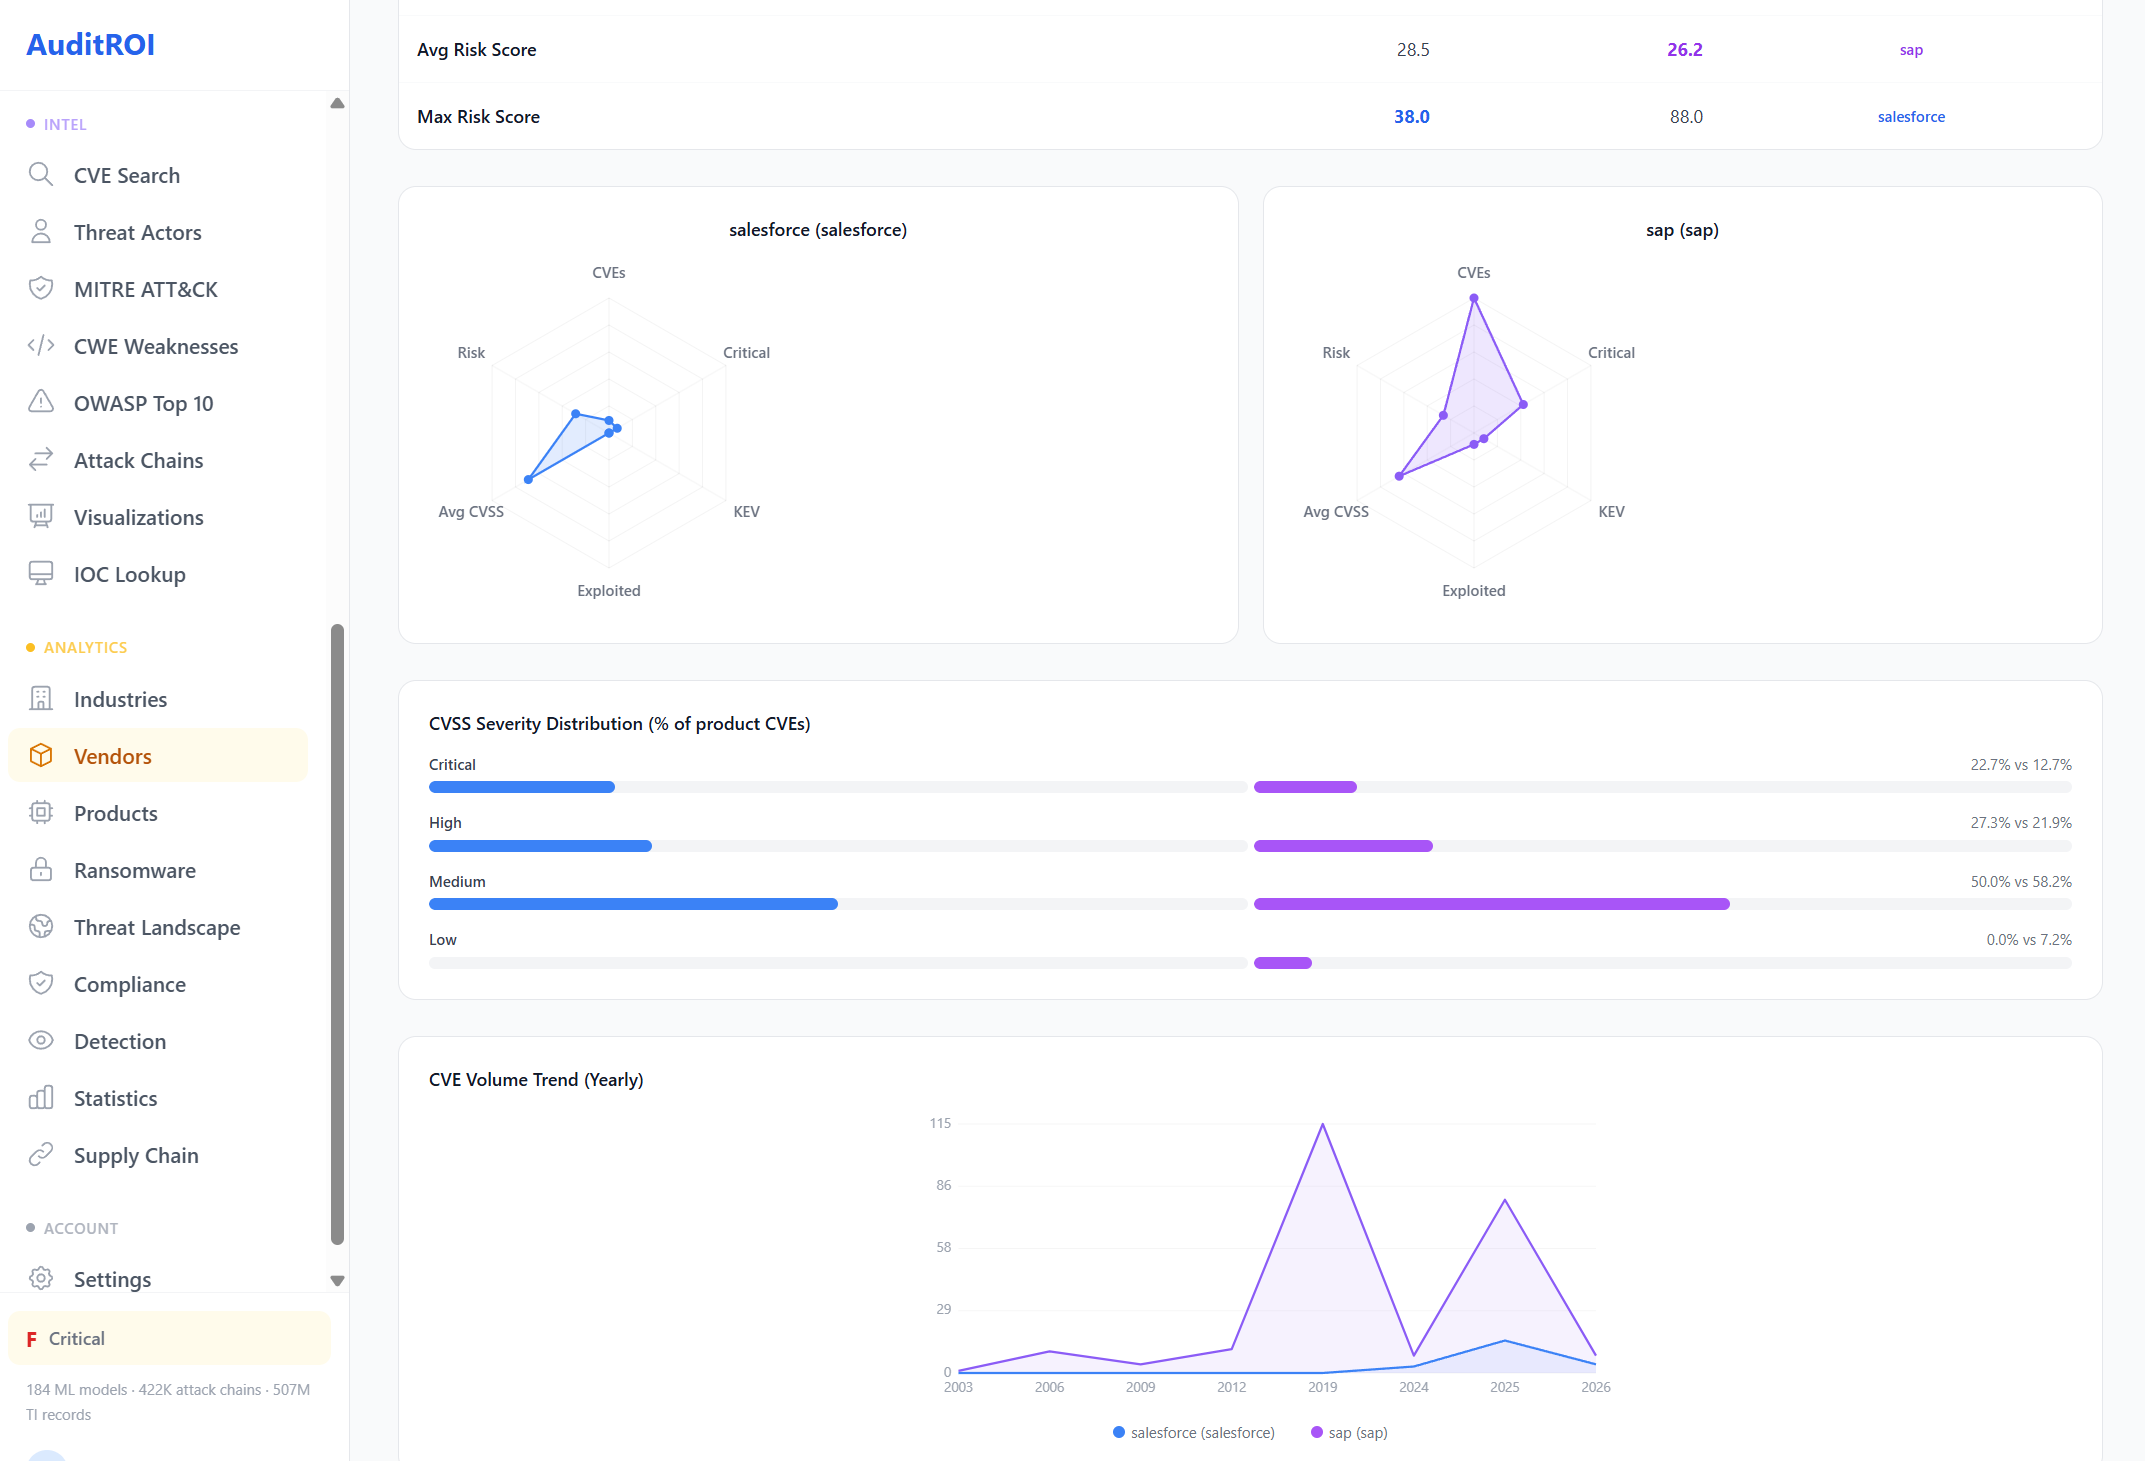
Which vendor poses less risk to your organization? Compare any two vendors side-by-side across 10 risk metrics — total CVEs, critical CVEs, KEV inclusion, exploit rate, CVSS, EPSS, ransomware links, and public exploits.
Each metric shows a clear winner. Radar charts visualize the risk profile shape. CVSS severity distribution reveals where the weight falls. CVE volume trends show whether risk is growing or declining. Data-driven vendor selection, not vendor marketing.
Product Risk Profiles
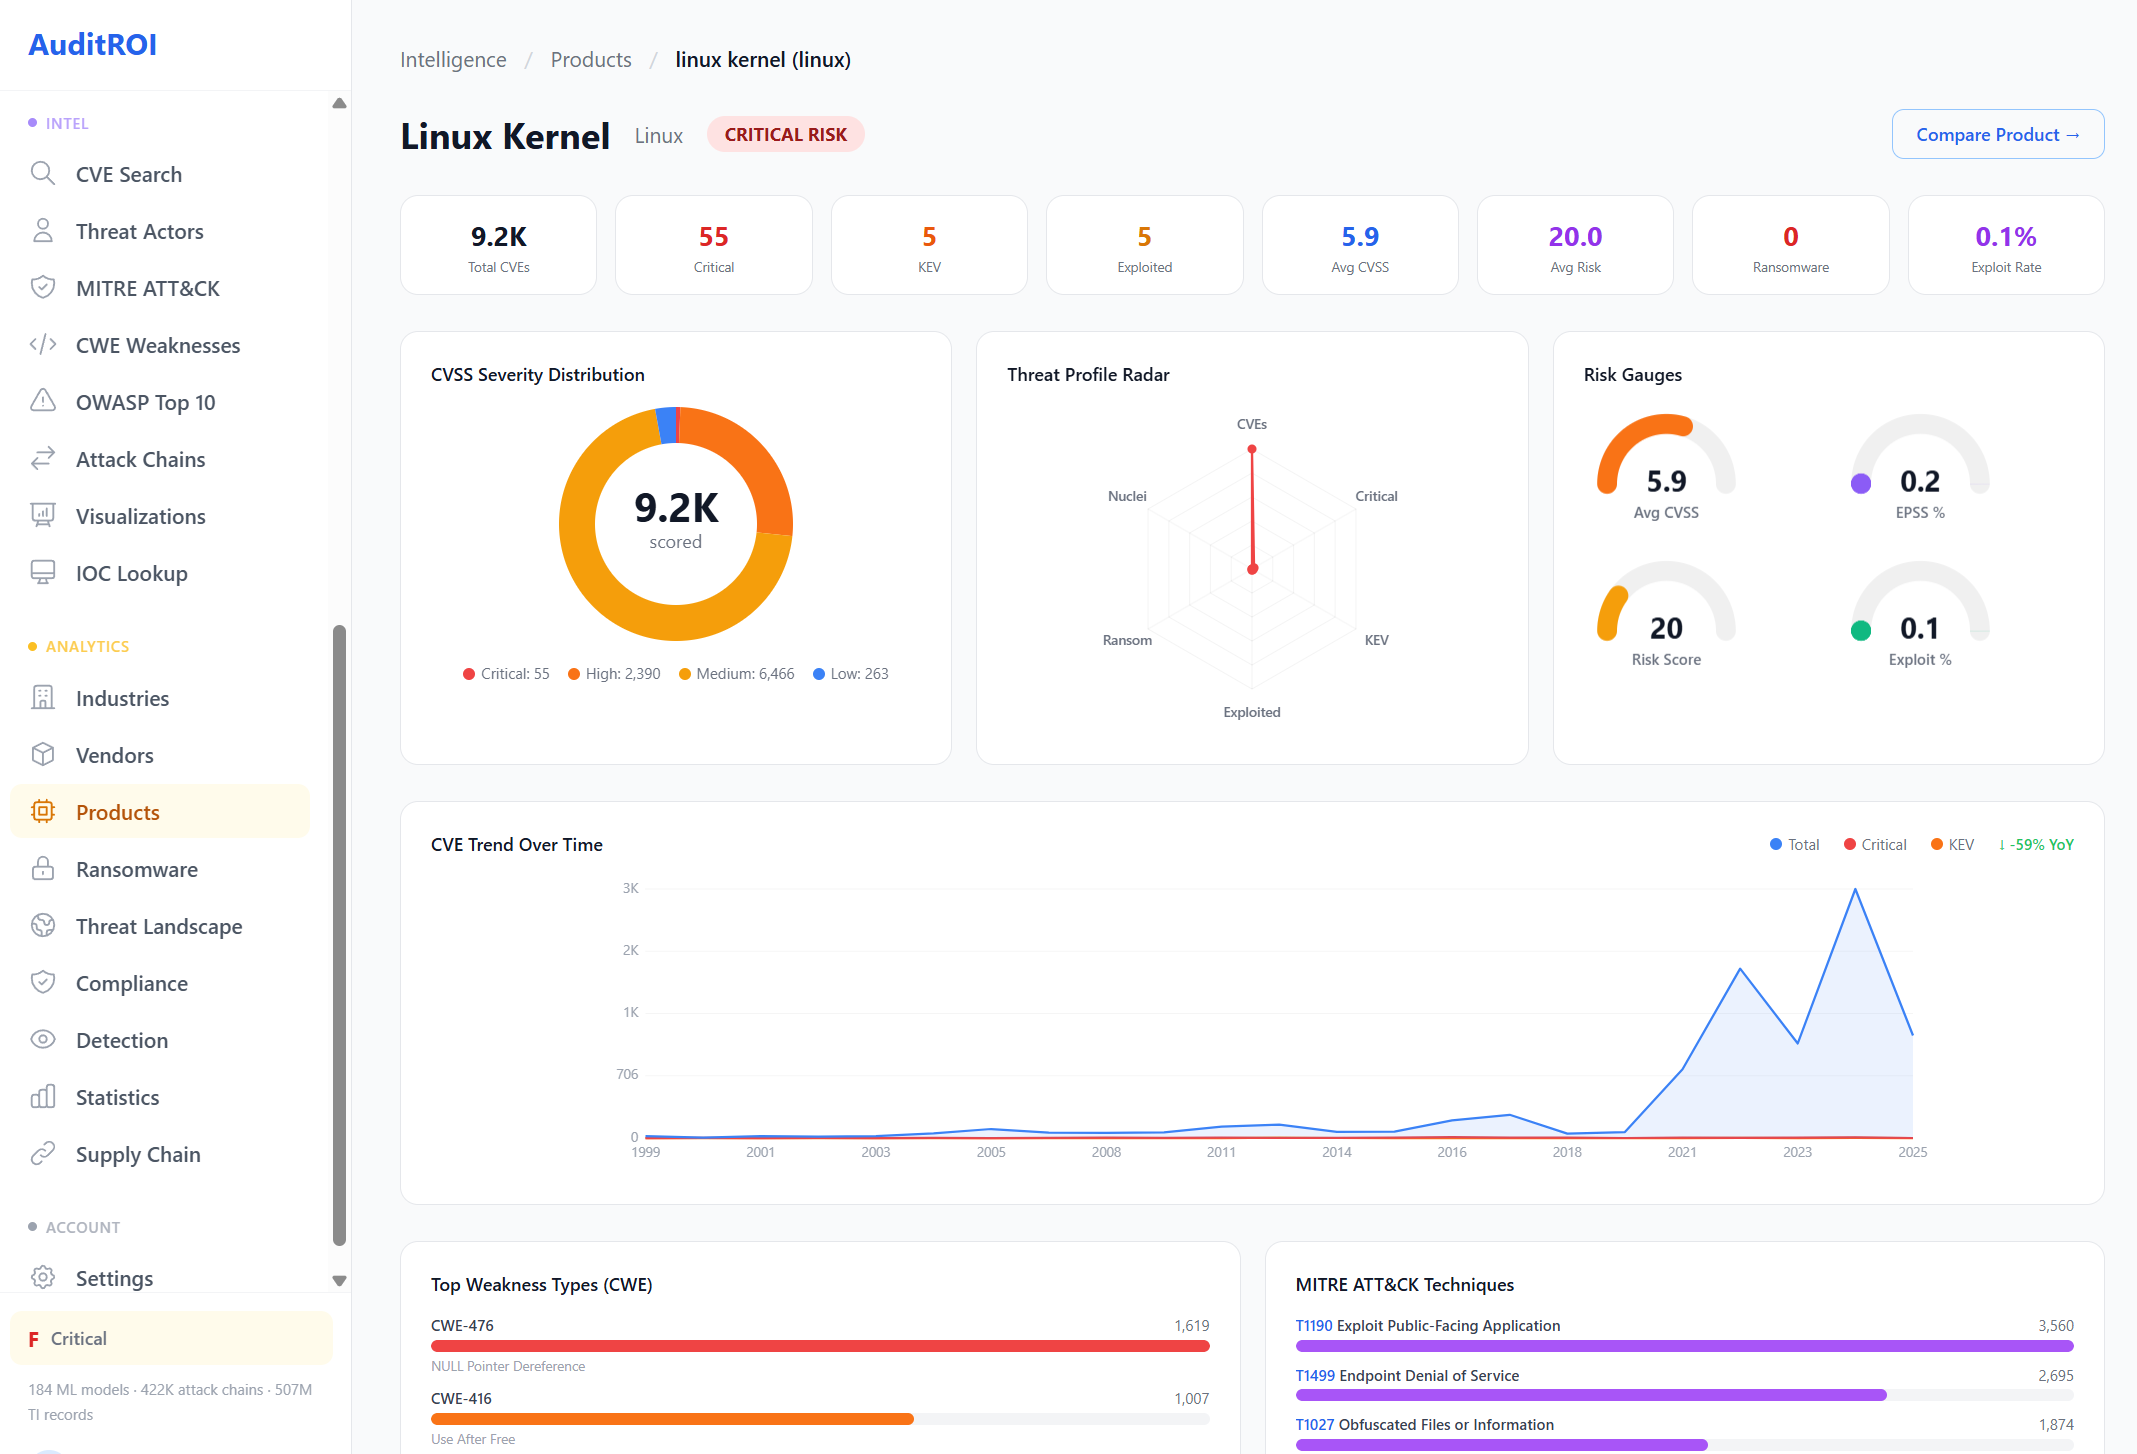
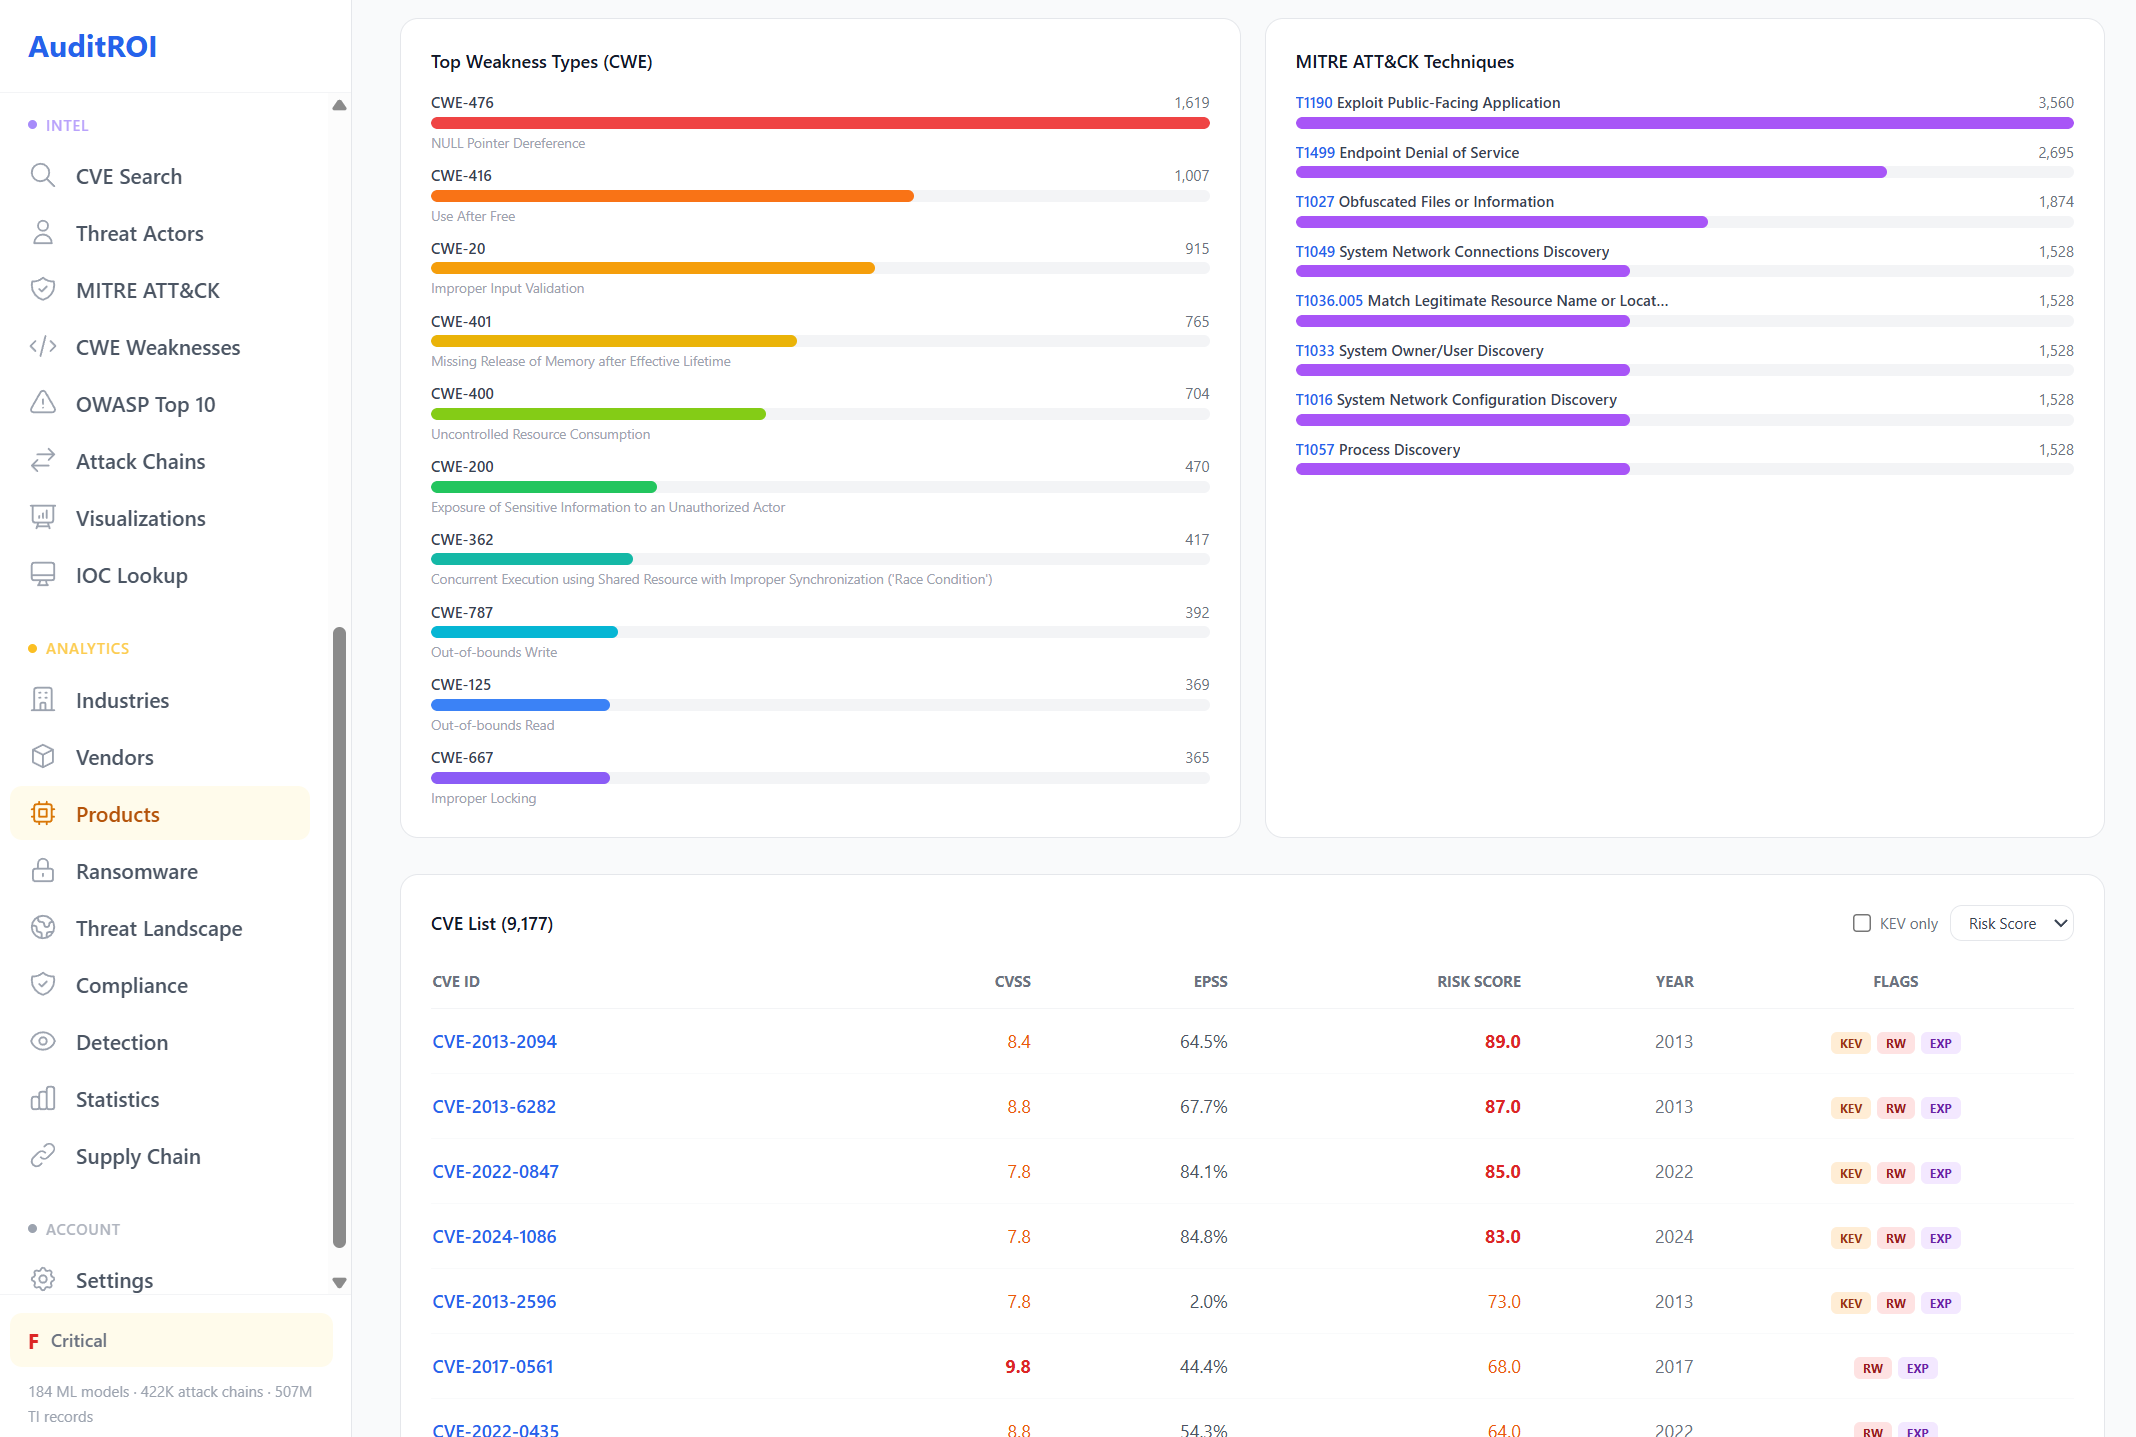
Go deeper than vendor-level analysis. We profile 15,570 individual software products — from Linux Kernel to Salesforce to SAP — each with their own risk dashboard, weakness breakdown, and CVE history.
Know exactly which products in your stack carry the most risk. Understand whether that risk is trending up or down. See the specific CWEs and MITRE techniques each product is exposed to.
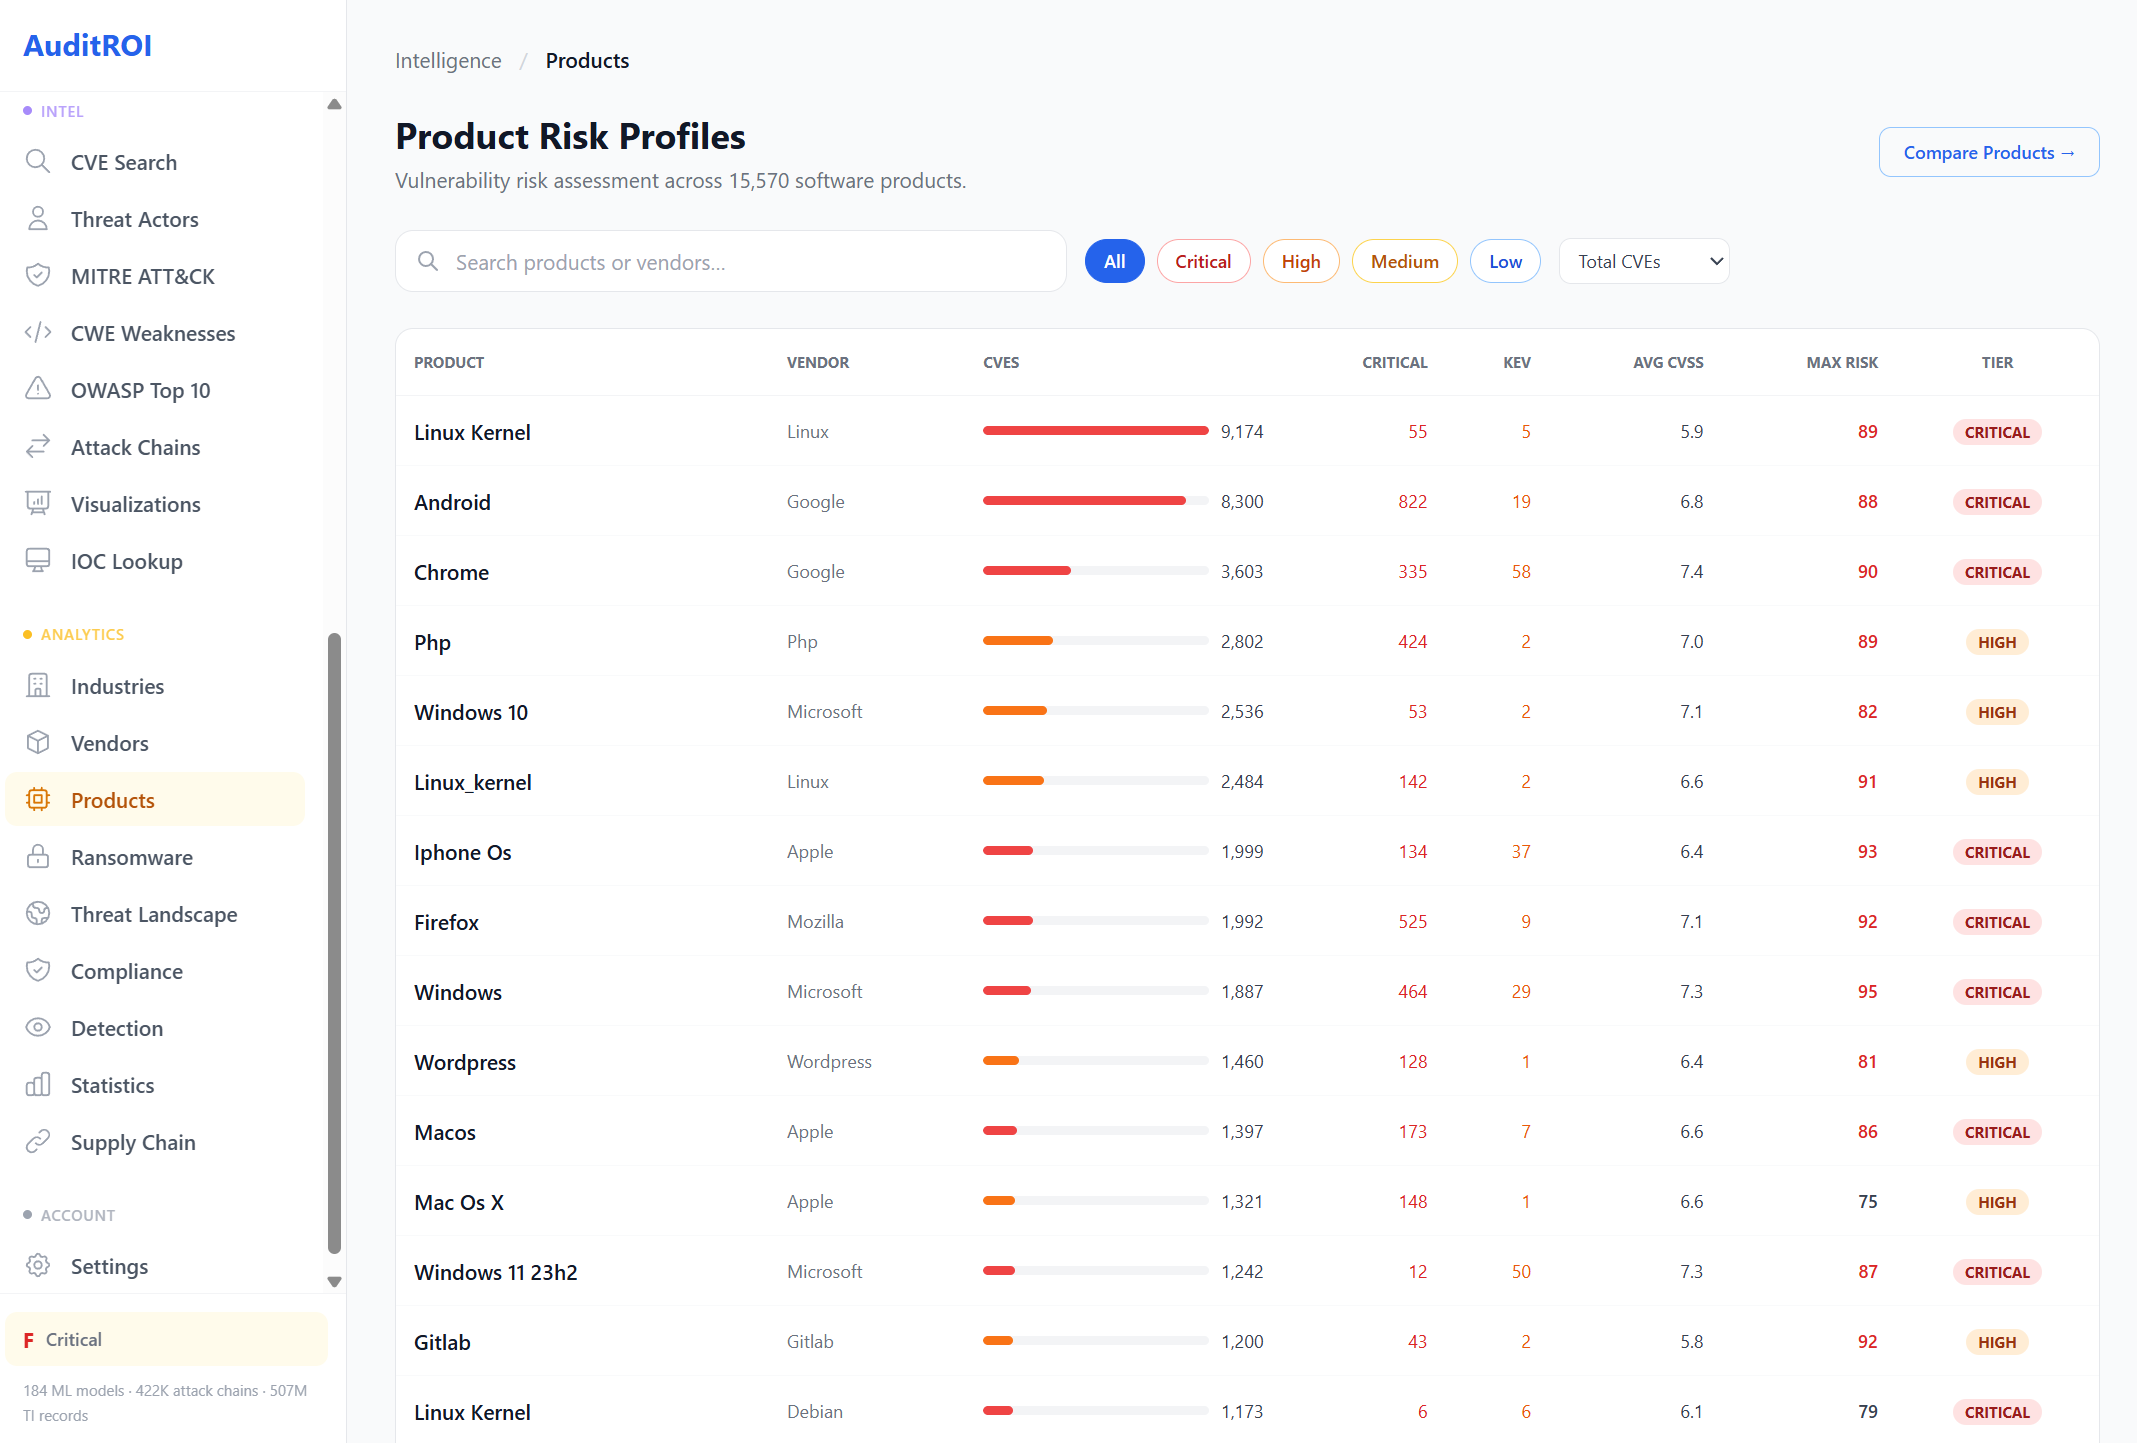
Example: Linux Kernel product profile. Compare any two products with the same depth.
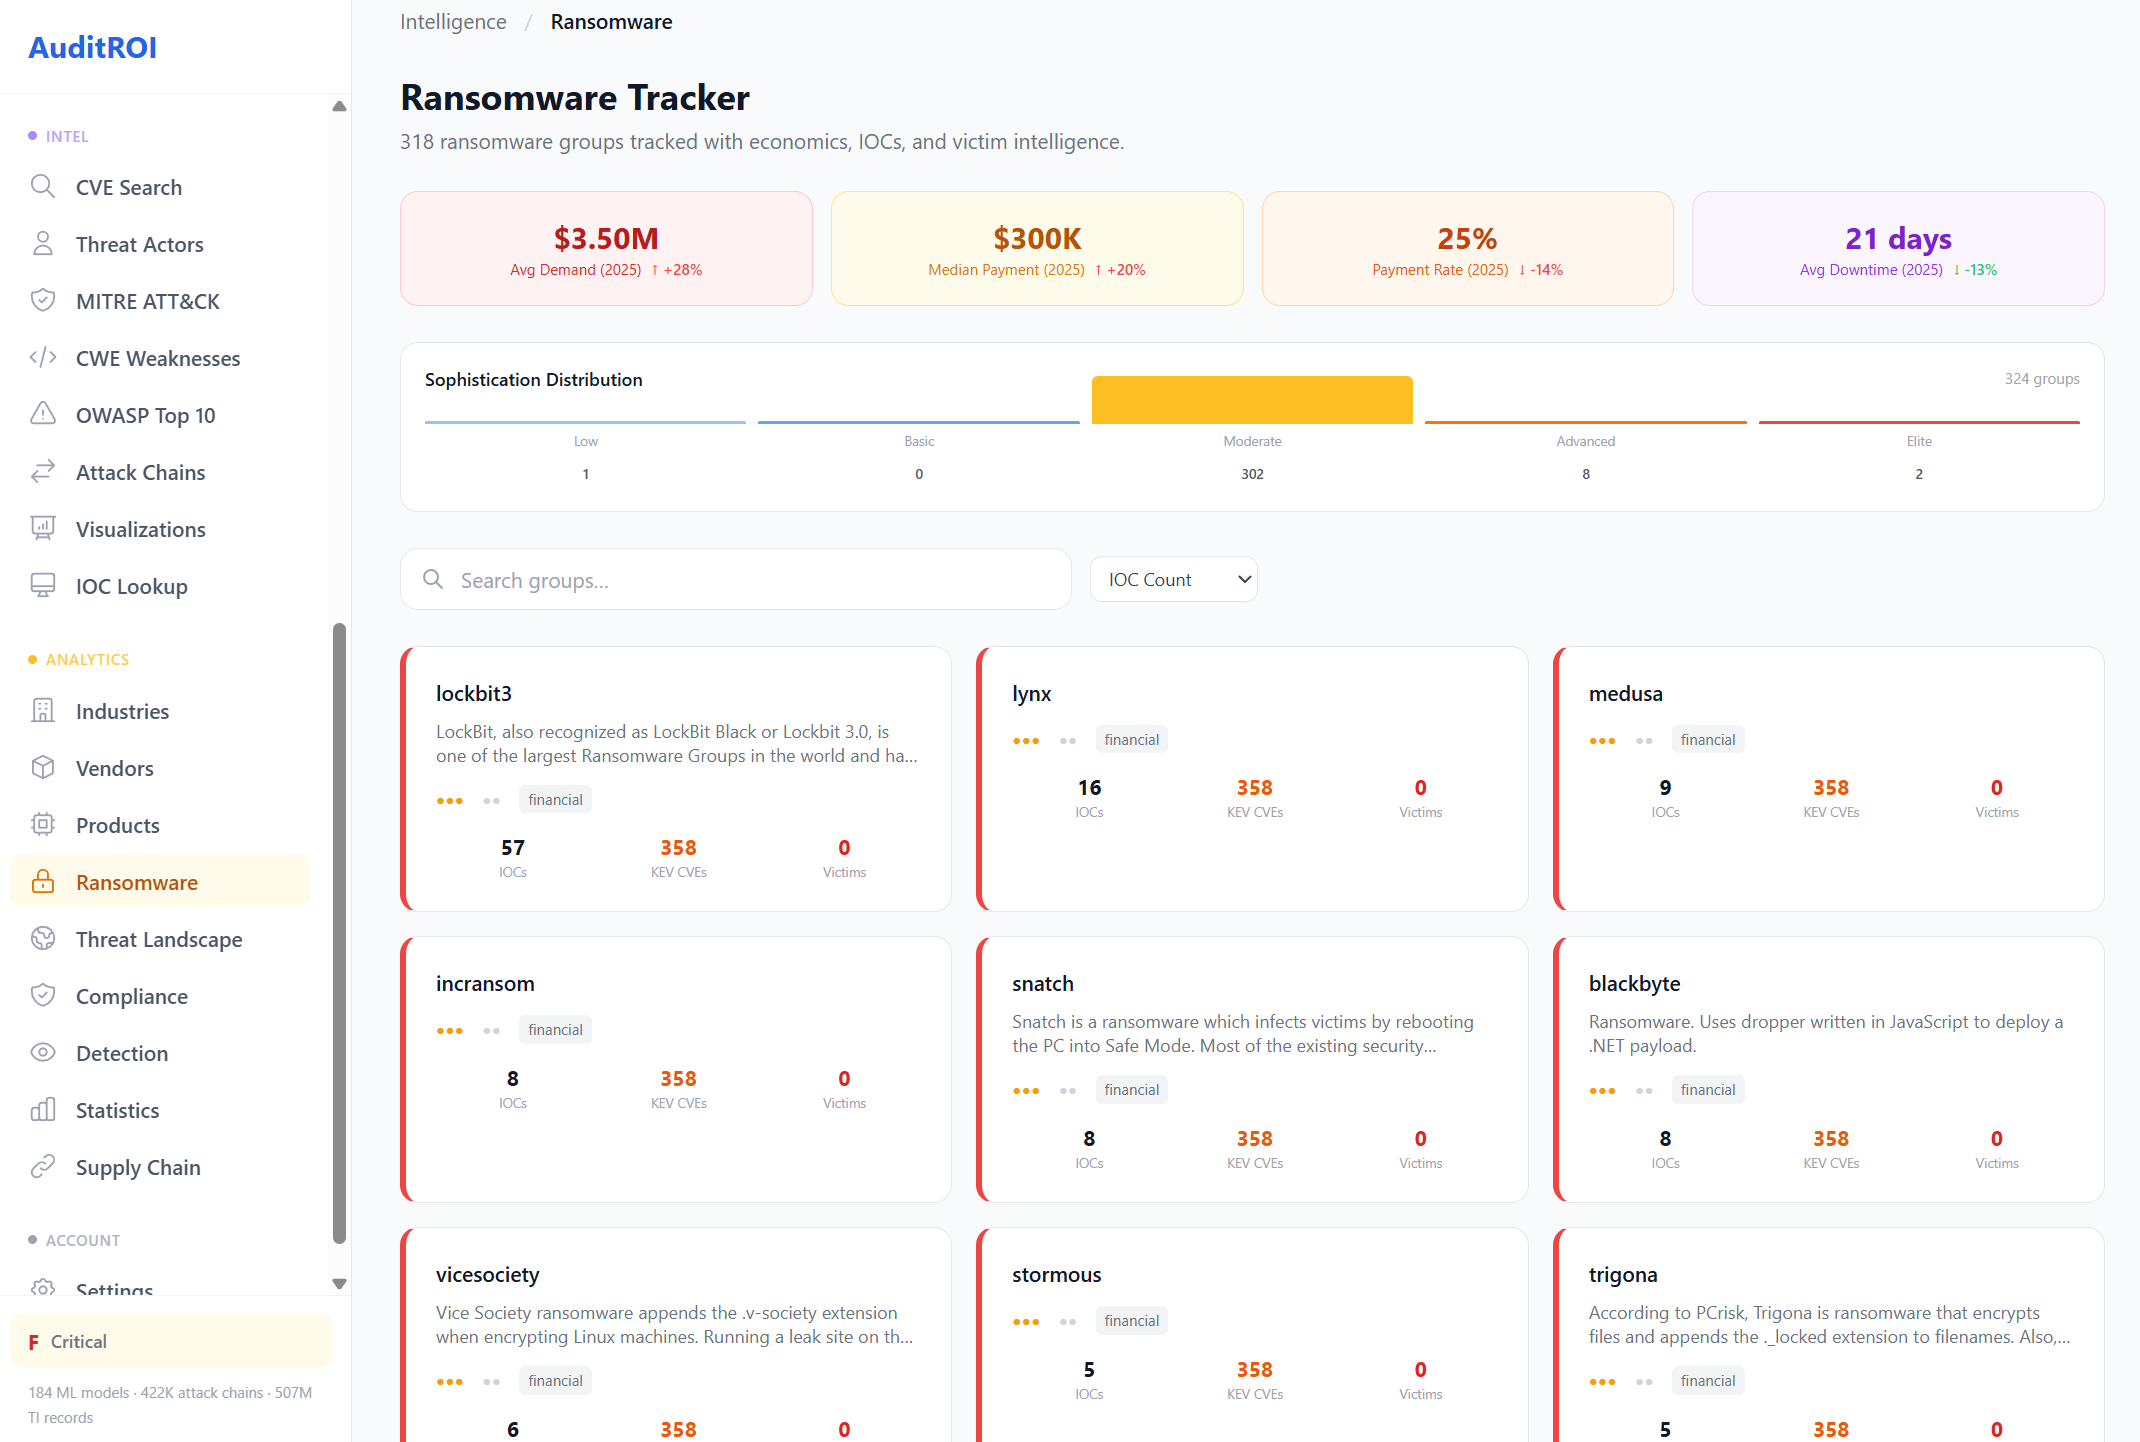
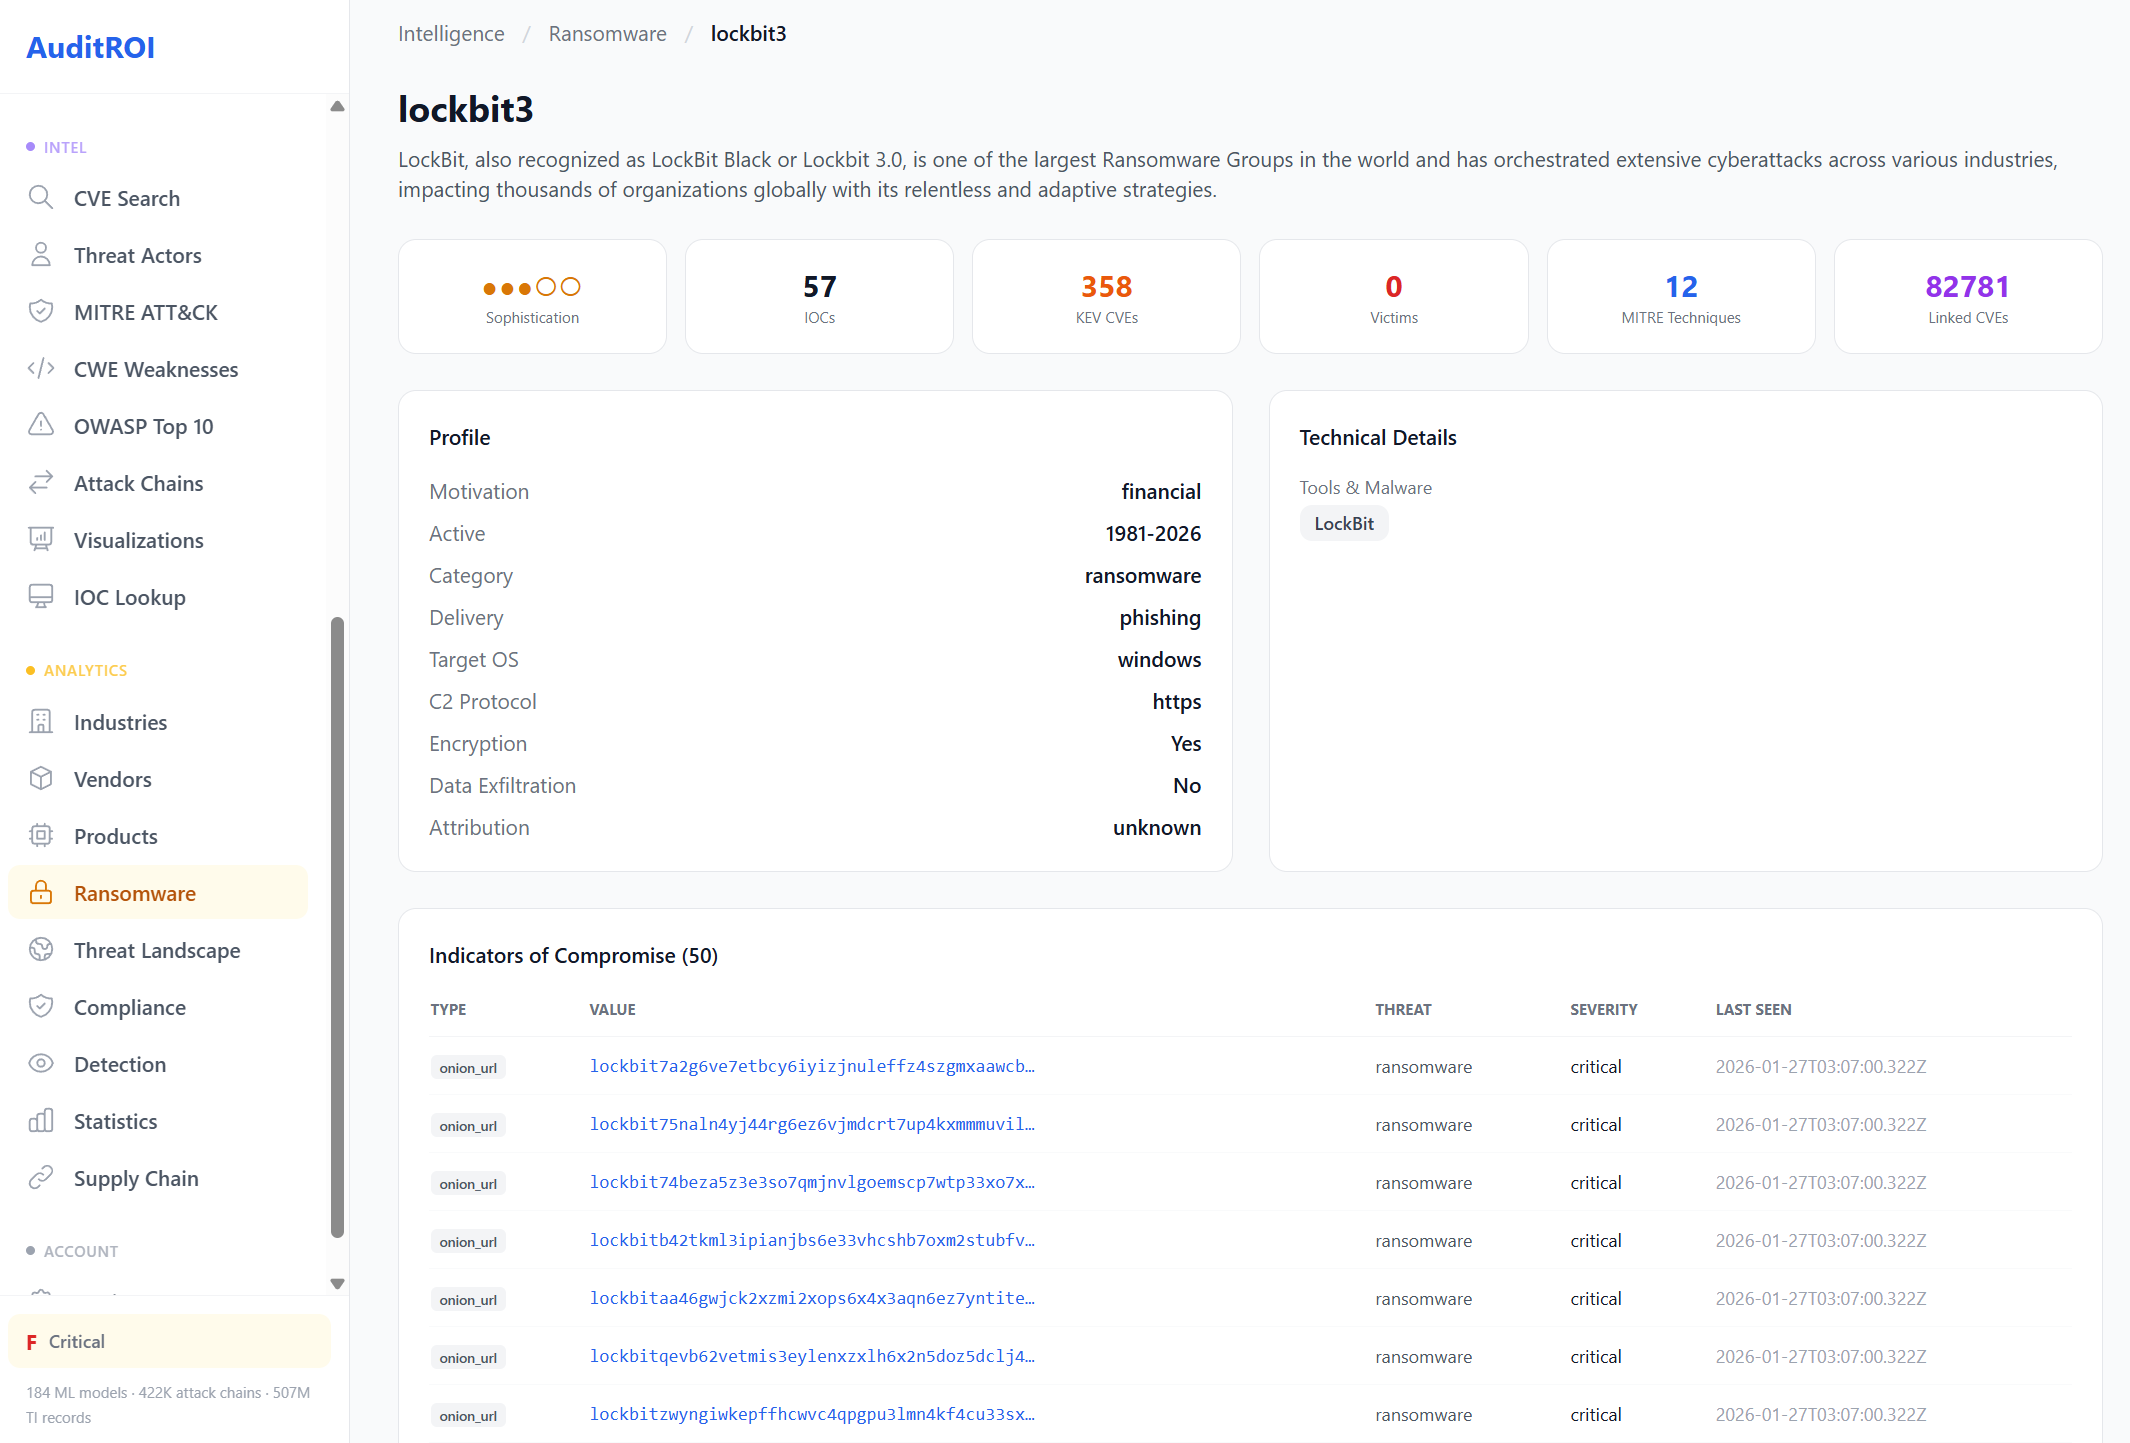
Ransomware Tracker
318 ransomware groups tracked with real economics: $3.5M average ransom demands, $300K median payments, 25% payment rates, and 21-day average downtime. These aren't abstractions — they're the numbers your CFO needs to see.
Each group is profiled with IOCs, CVE exploitation patterns, target industries, C2 infrastructure, sophistication scoring, and MITRE technique mappings. When your scan finds a vulnerability that LockBit exploits, you'll know immediately.
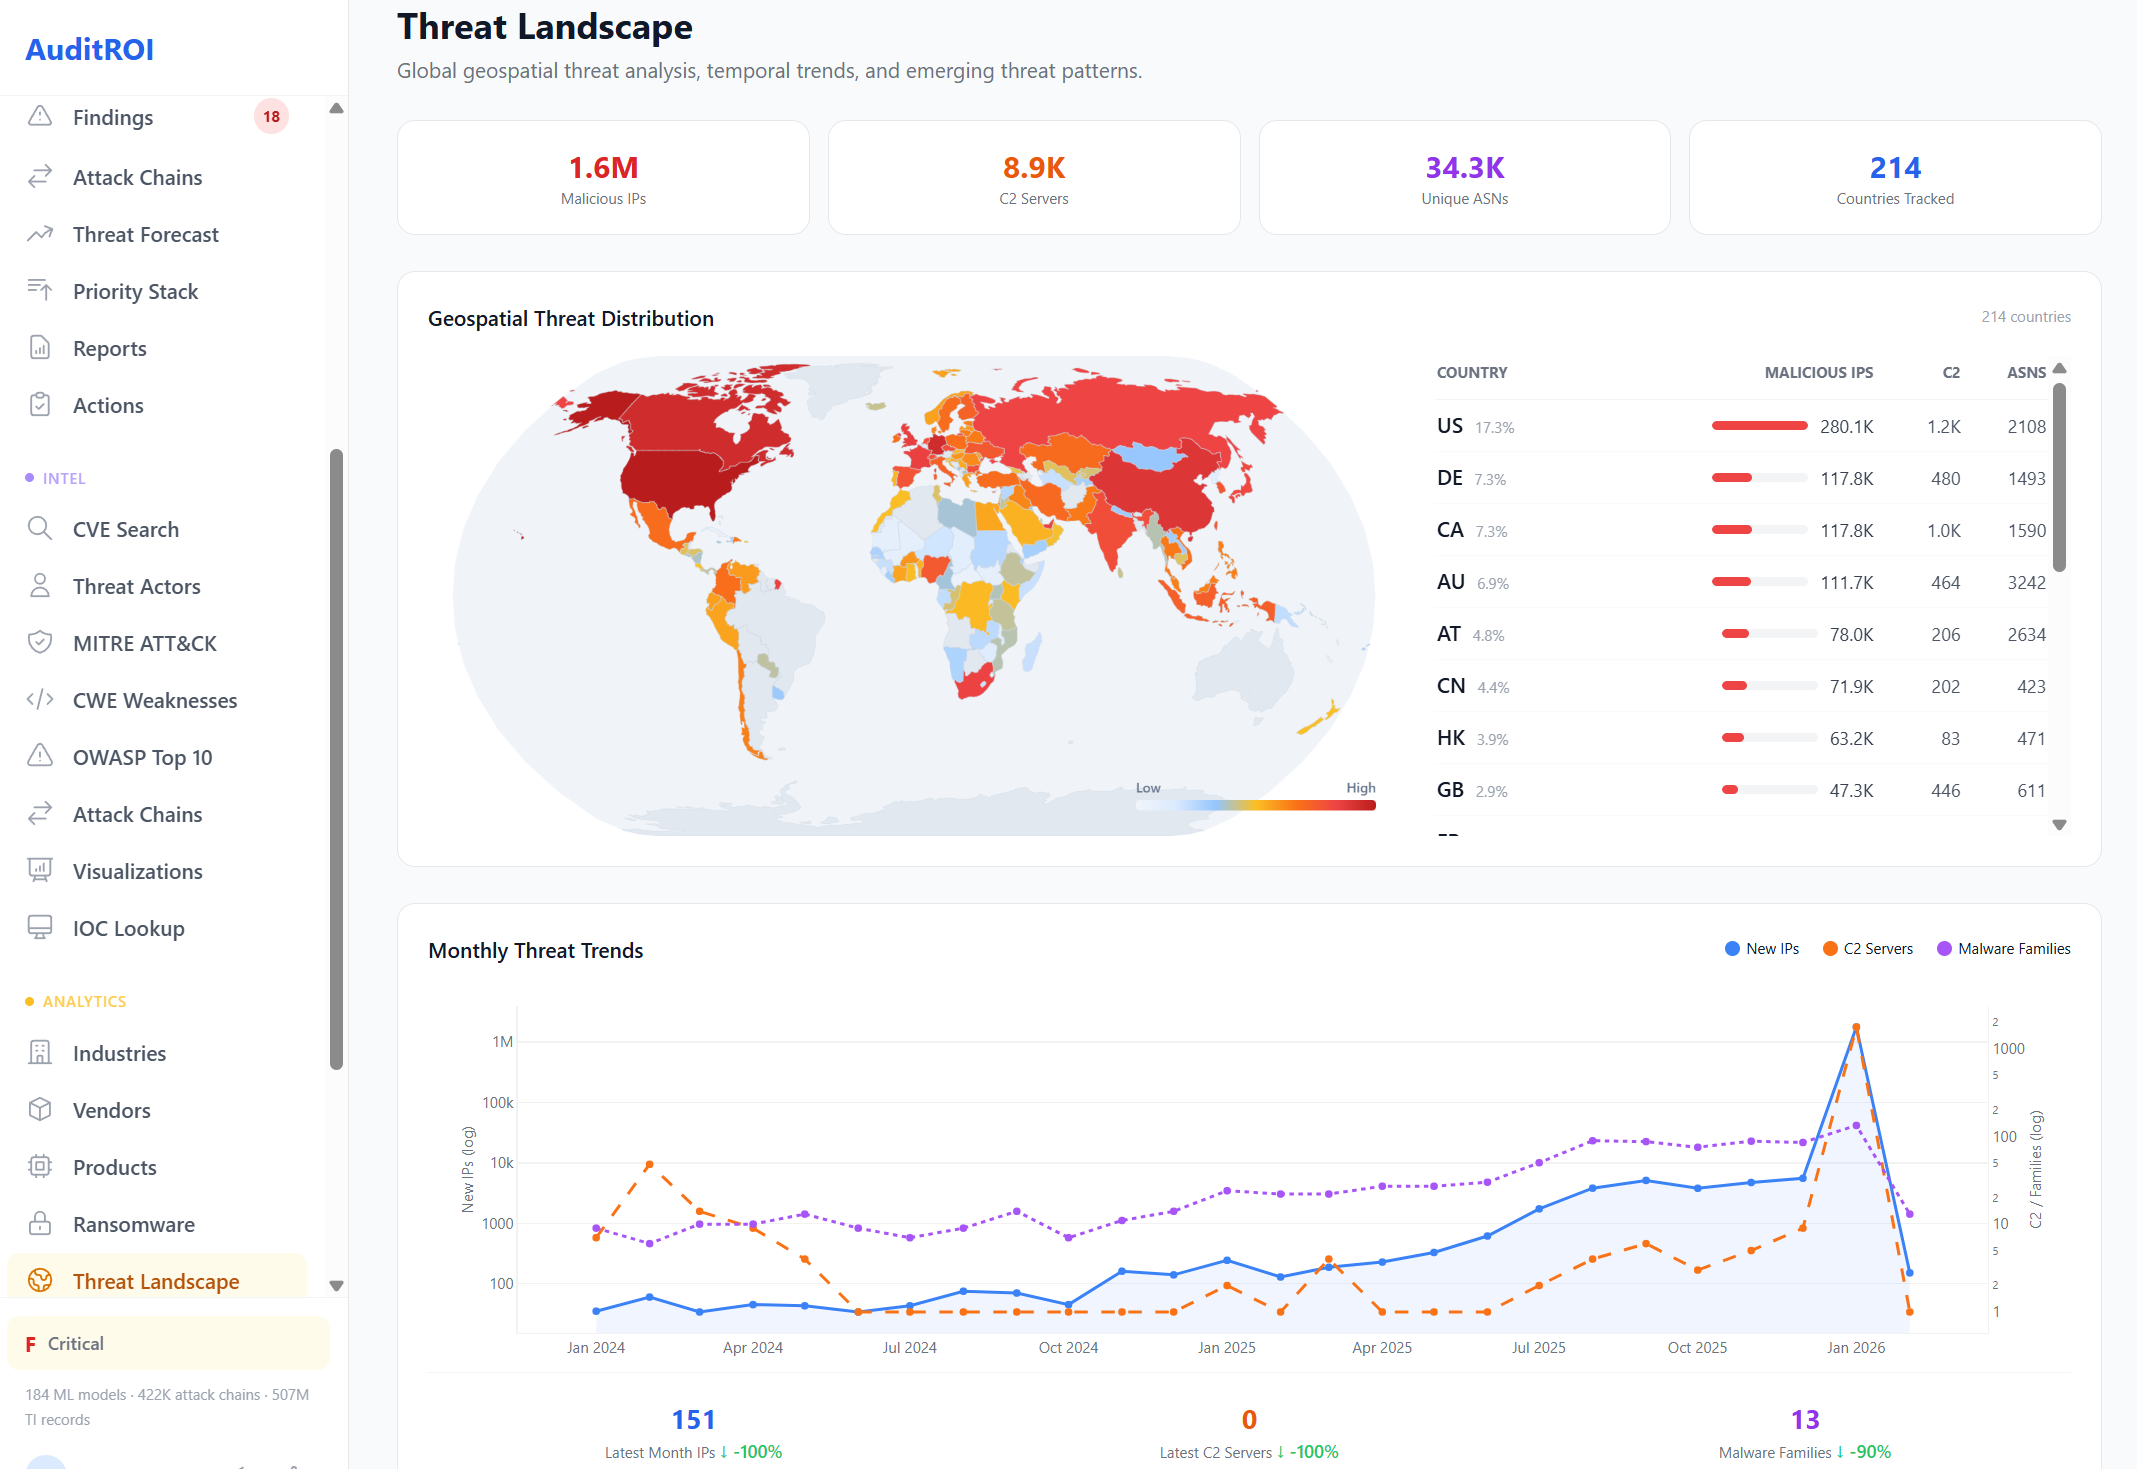
Global Threat Landscape
A geospatial view of the global threat landscape. 1.6M malicious IPs, 8.9K C2 servers, and 34.3K unique ASNs mapped across 214 countries. See where threats originate and how they evolve month over month.
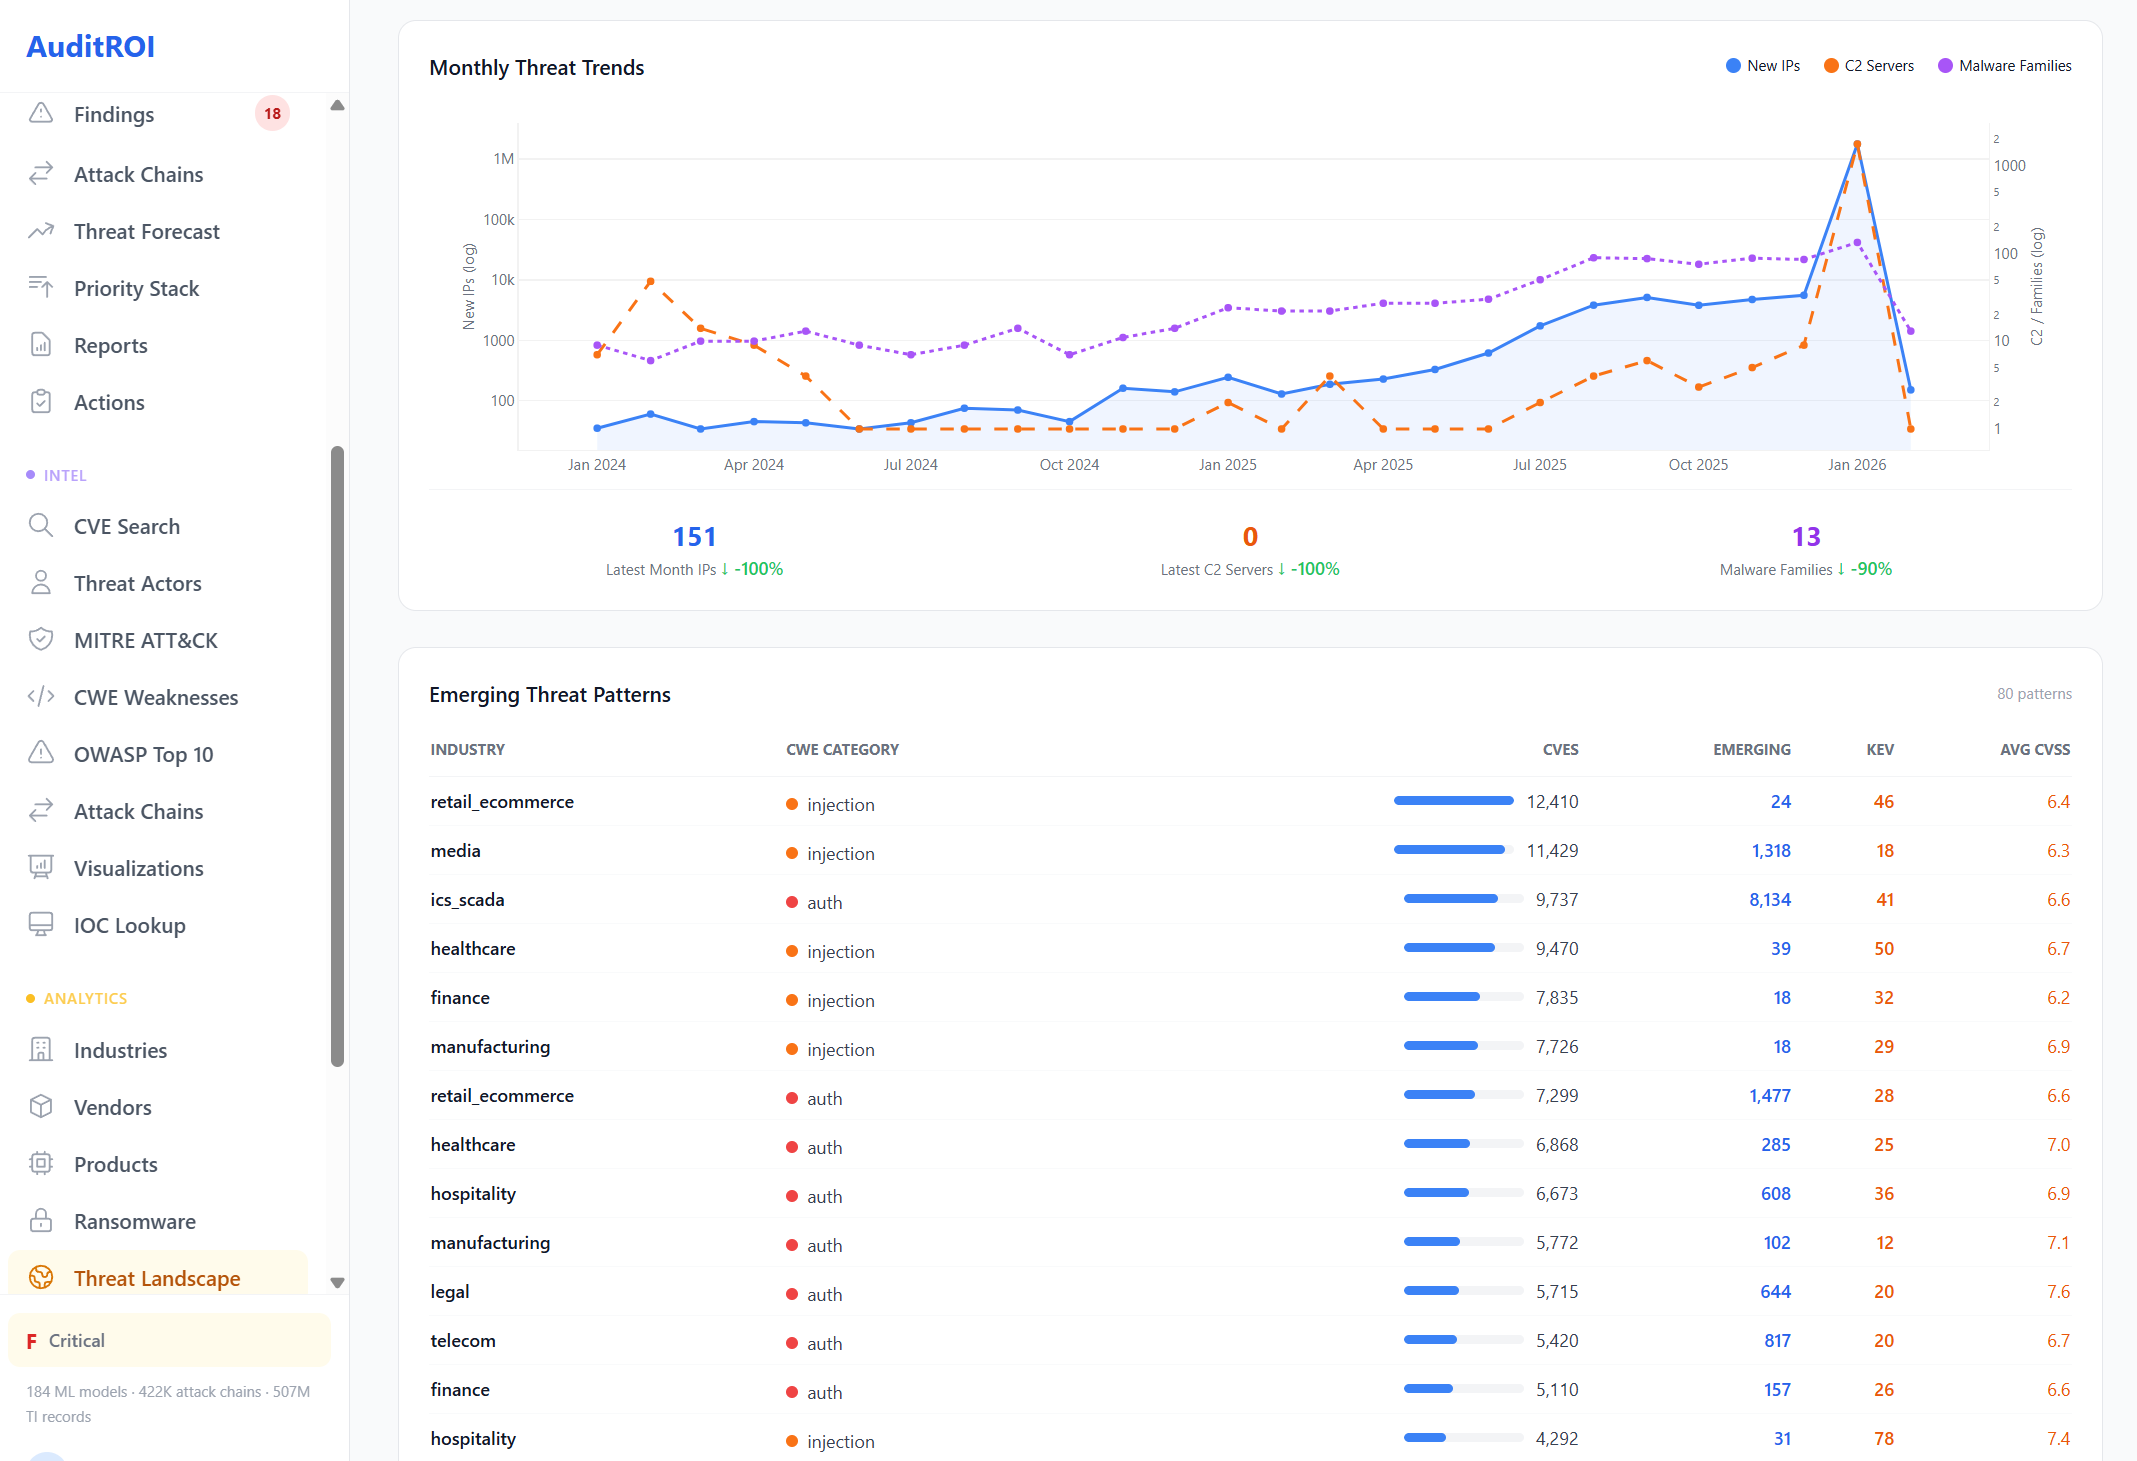
Monthly trend analysis tracks new malicious IPs, C2 server growth, and malware family evolution. Emerging threat patterns reveal what's coming next, broken down by industry and vulnerability category.
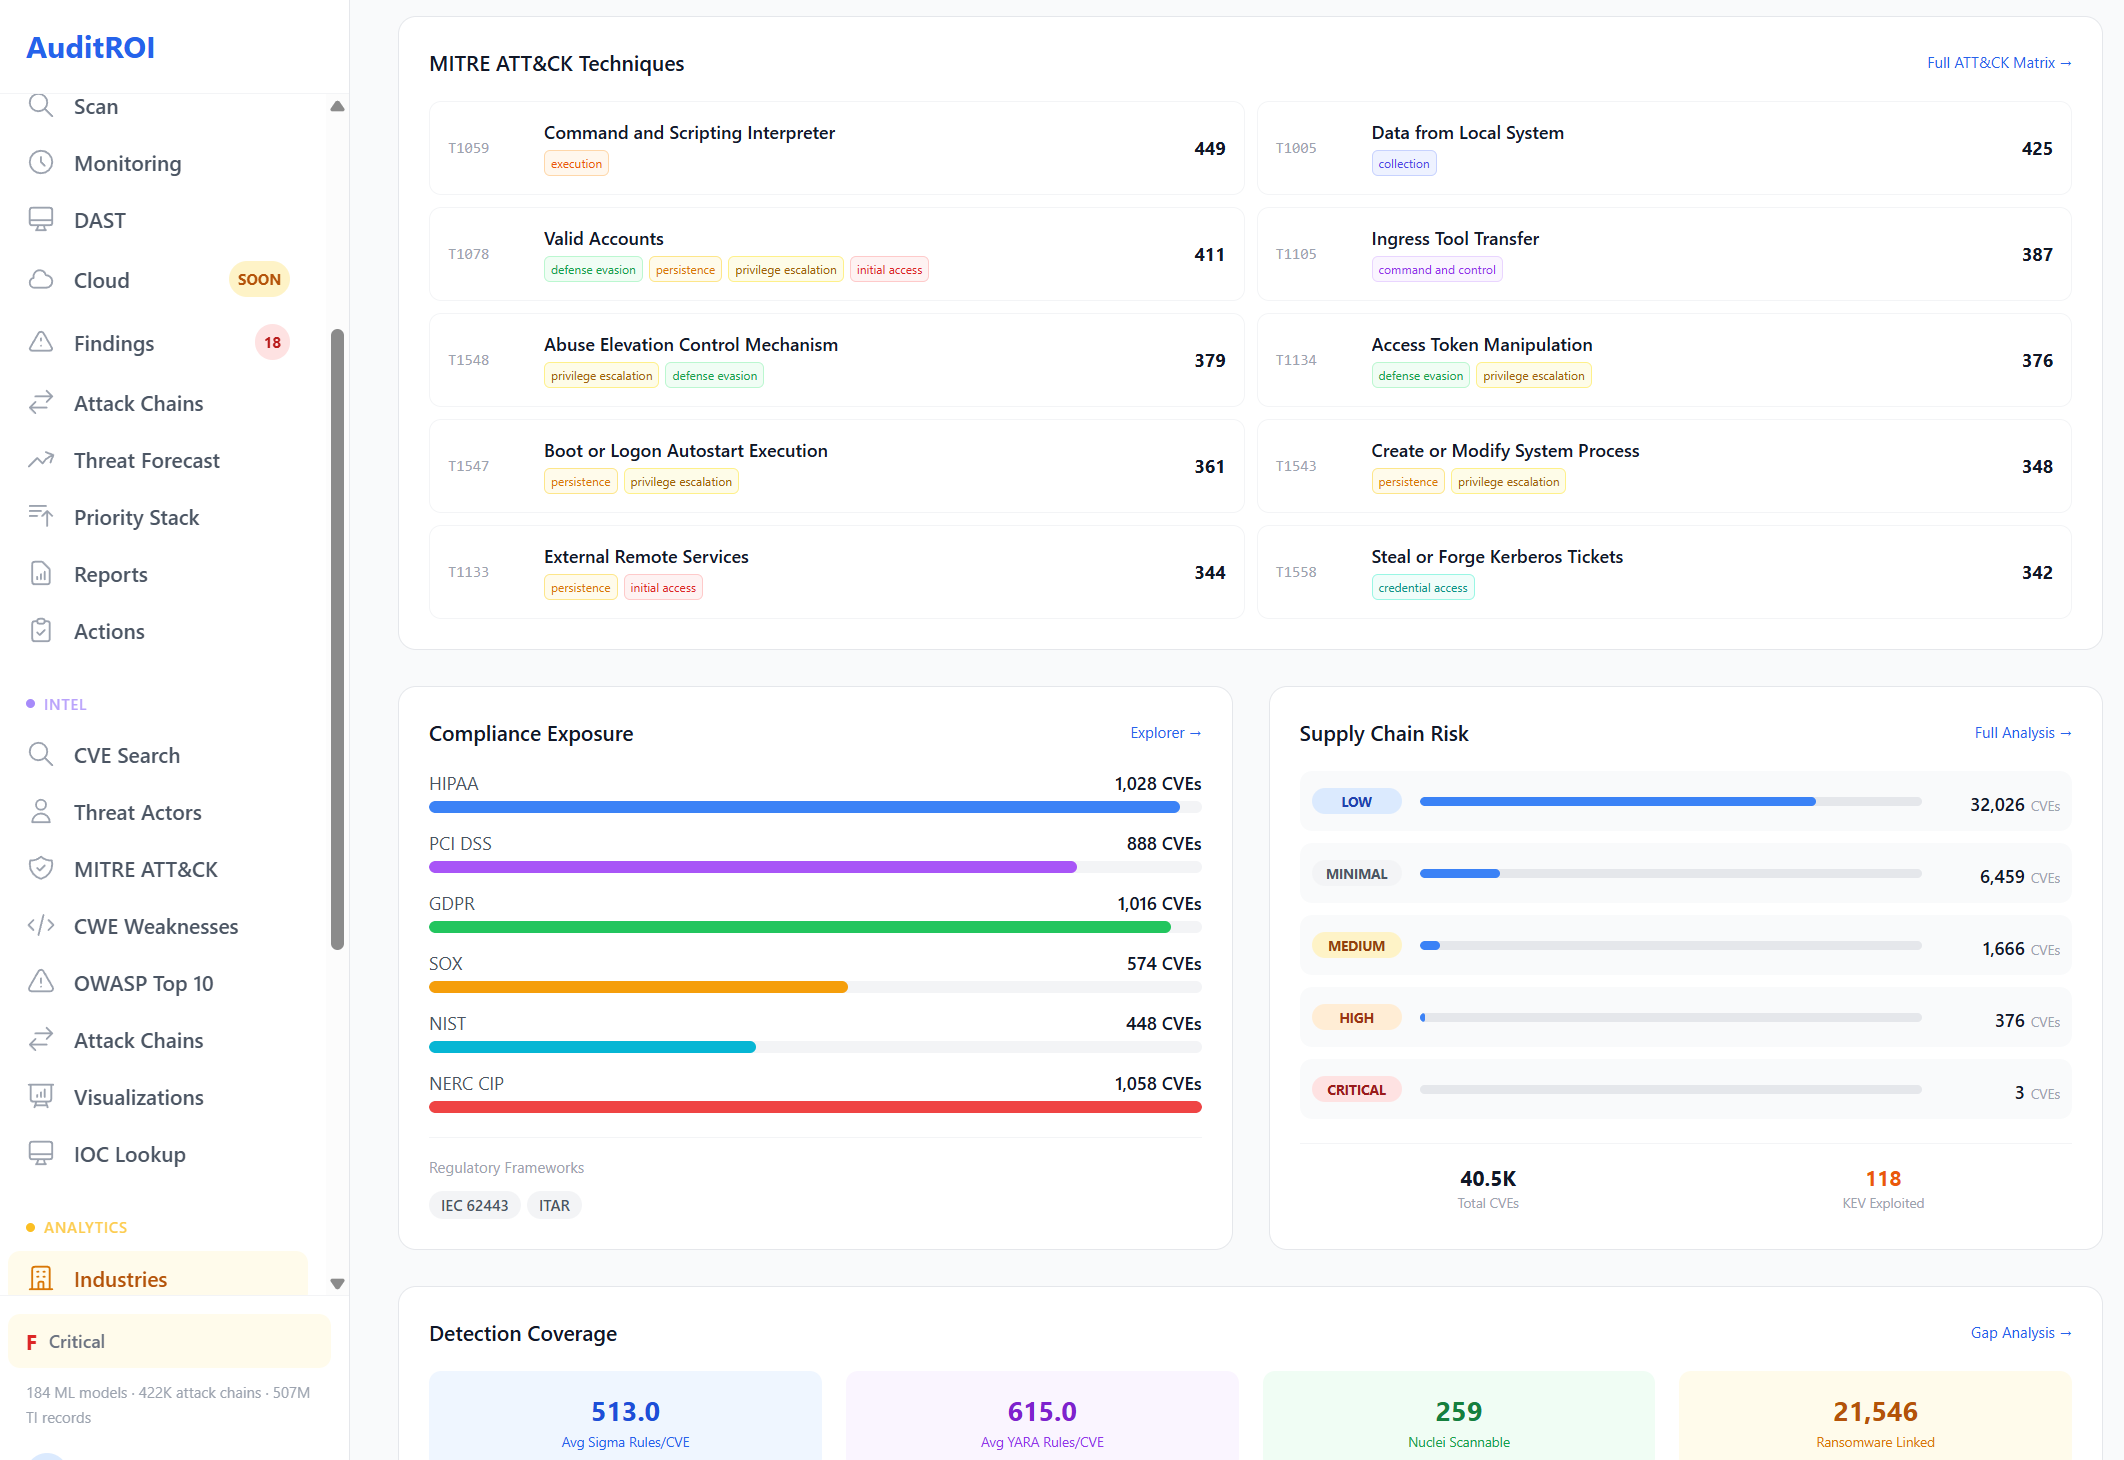
Compliance, Detection & Supply Chain
Three specialized modules that connect vulnerability data to the frameworks and processes your organization actually uses. Map CVEs to regulatory requirements, find detection gaps, and assess third-party risk.
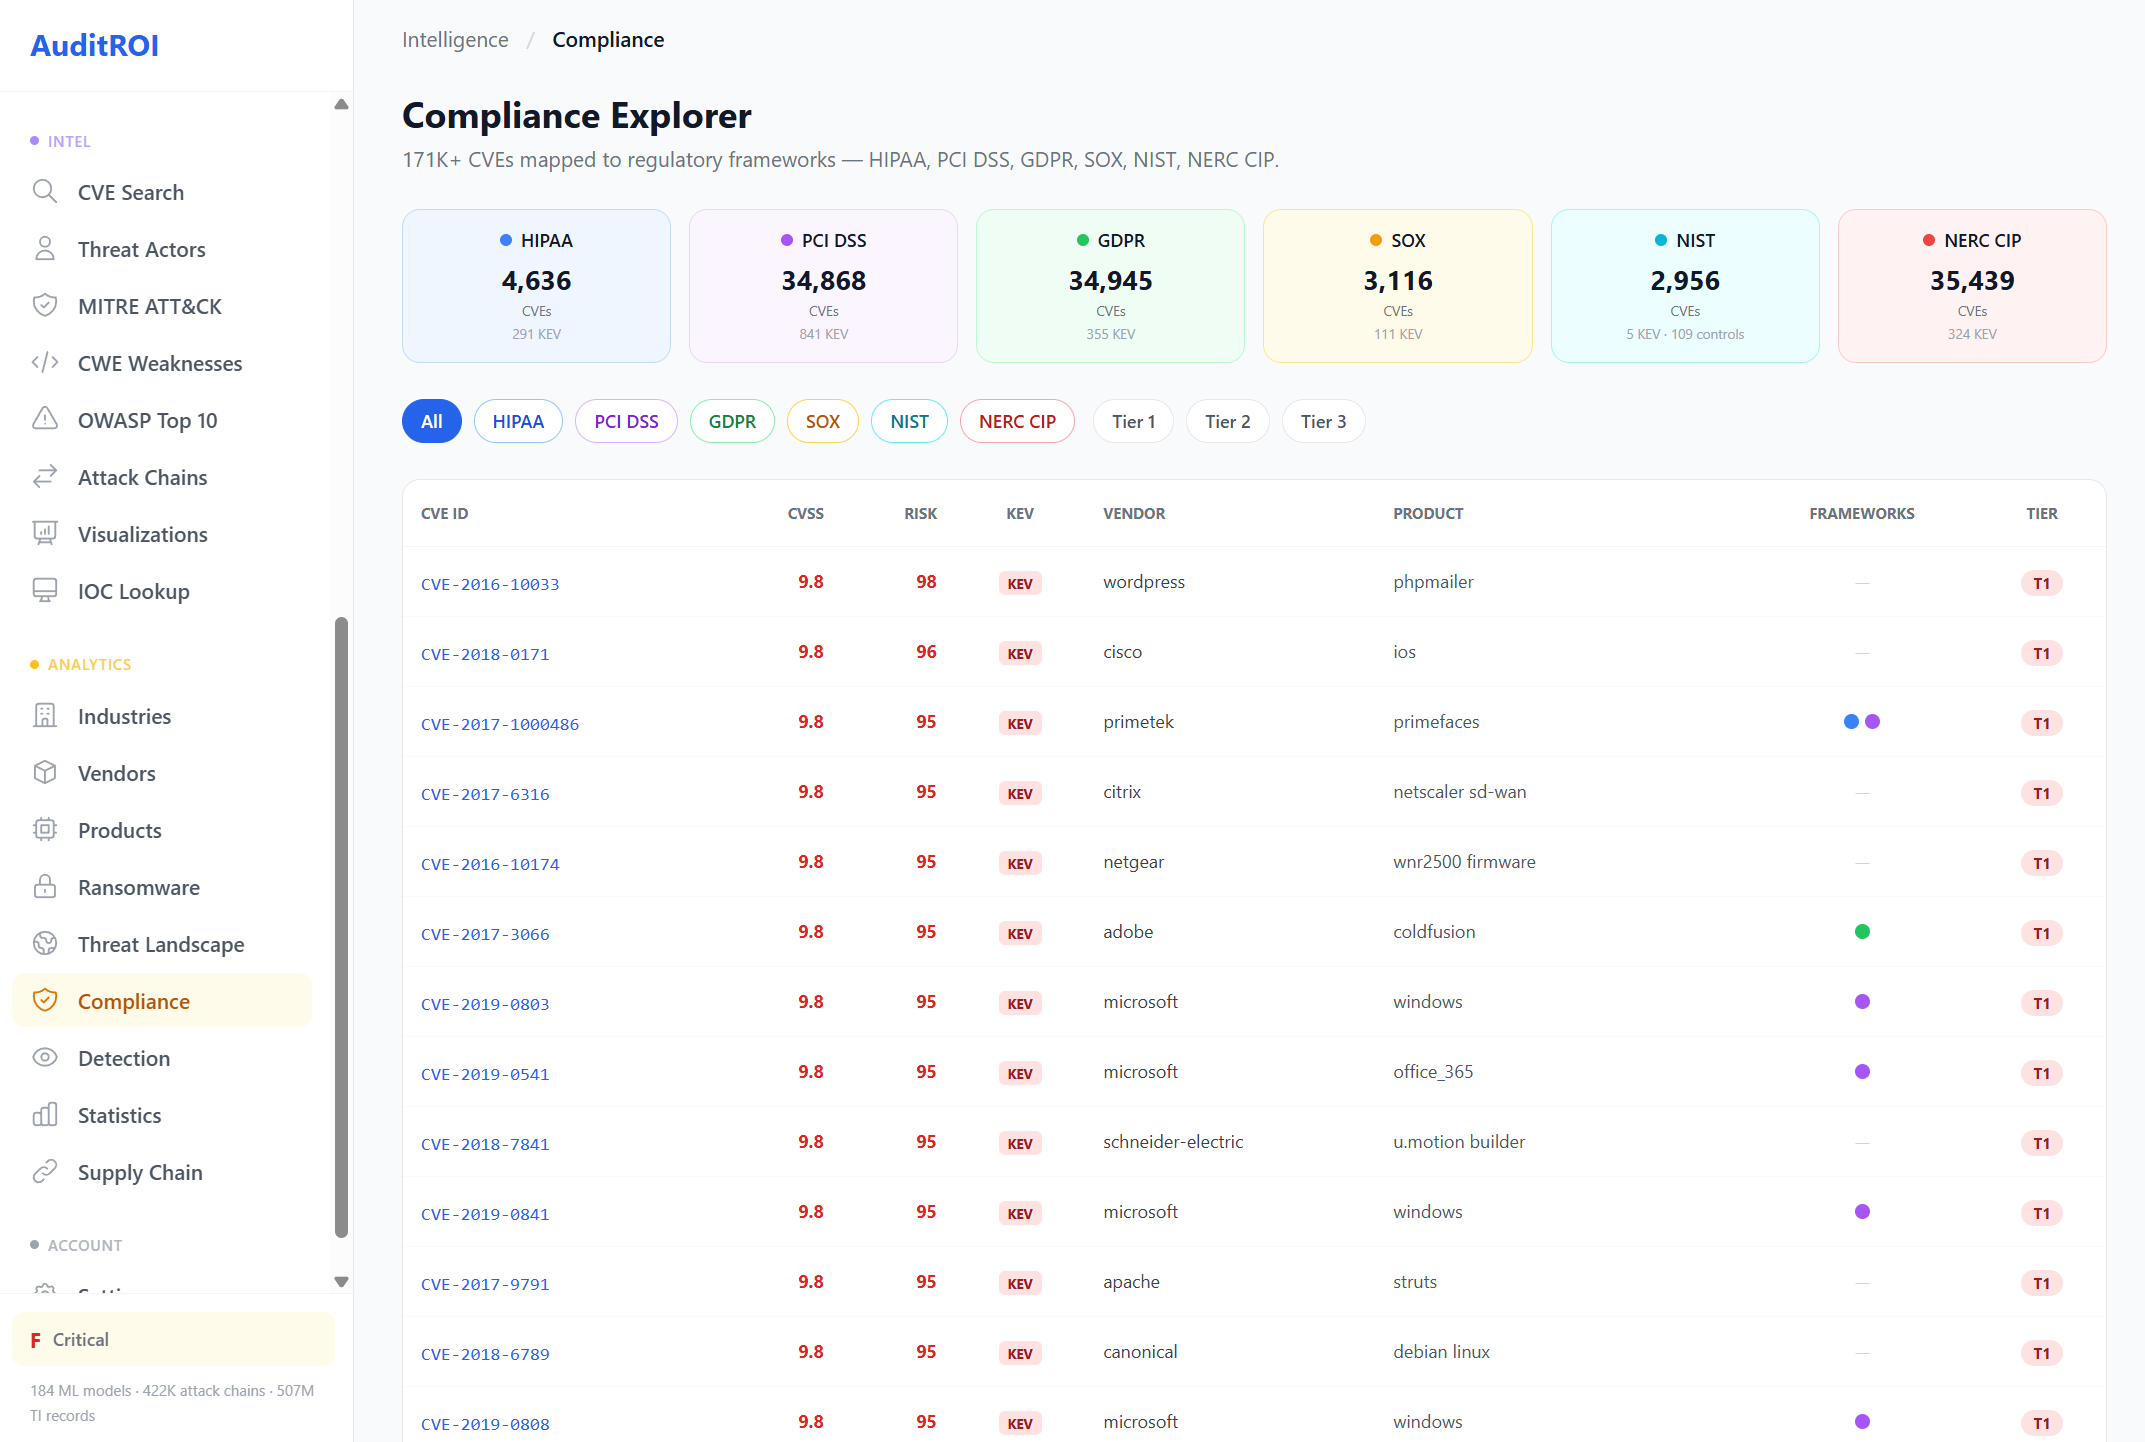
Compliance Explorer
177K+ CVEs mapped to six regulatory frameworks: HIPAA, PCI DSS, GDPR, SOX, NIST, and NERC CIP.
Filter by framework, severity, vendor, or product. Instantly see which vulnerabilities in your scan affect your compliance posture.
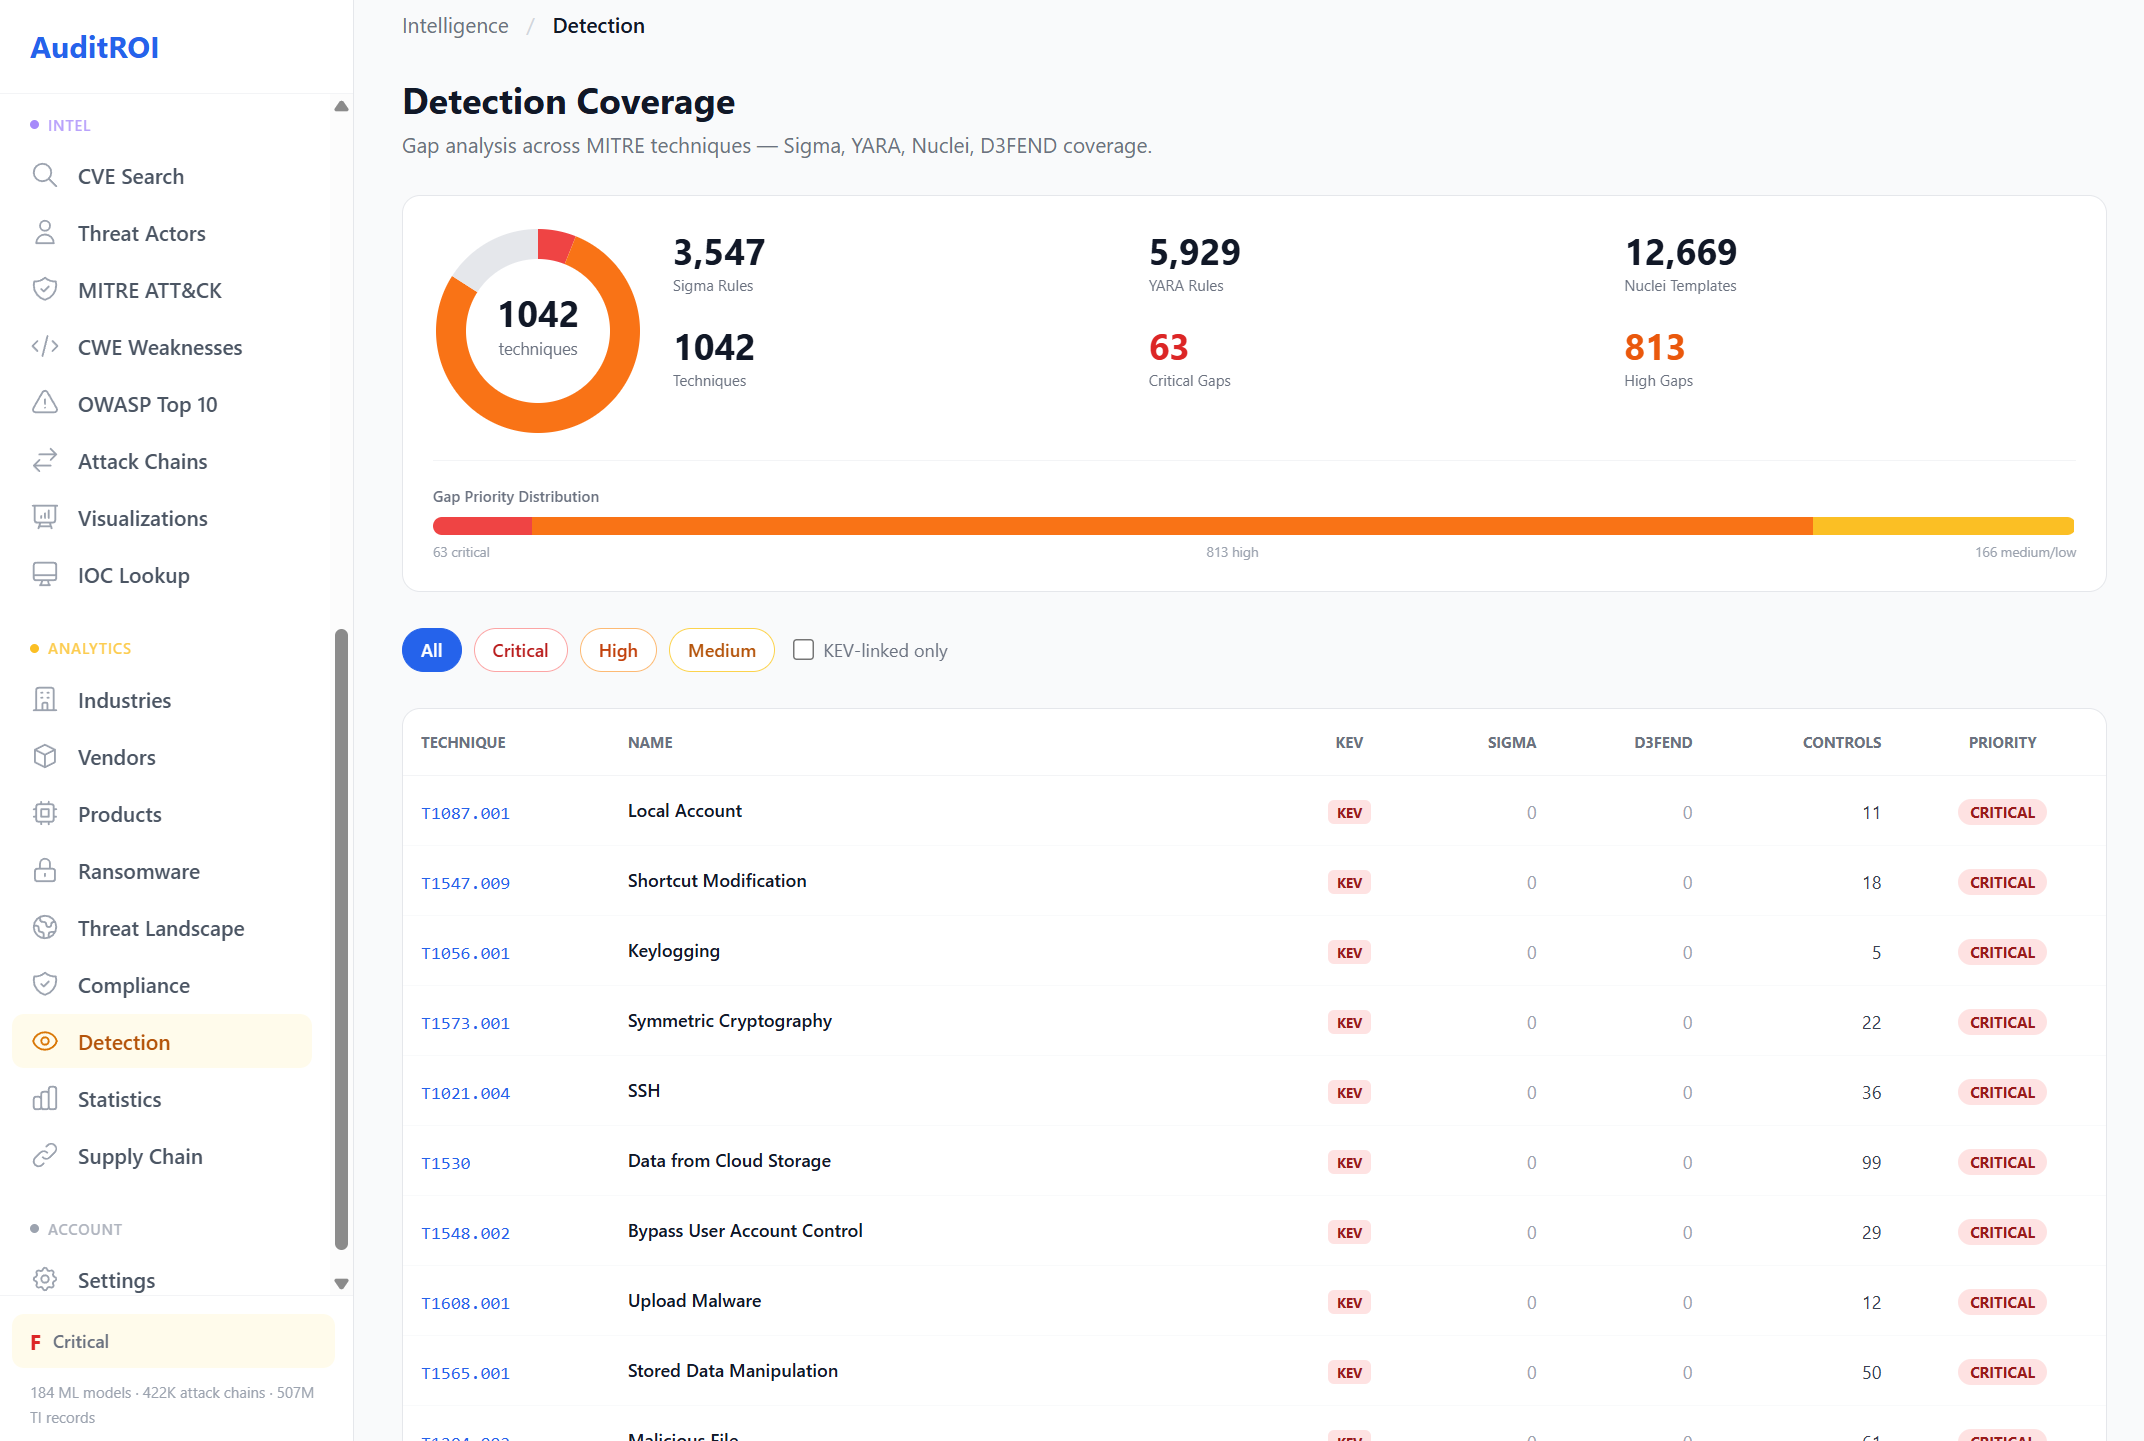
Detection Coverage
Gap analysis across 1,042 MITRE ATT&CK techniques. See exactly where your detection has blind spots.
Covers 3,547 Sigma rules, 5,929 YARA rules, 12,669 Nuclei templates, and 813 D3FEND countermeasures. Prioritized by gap criticality.
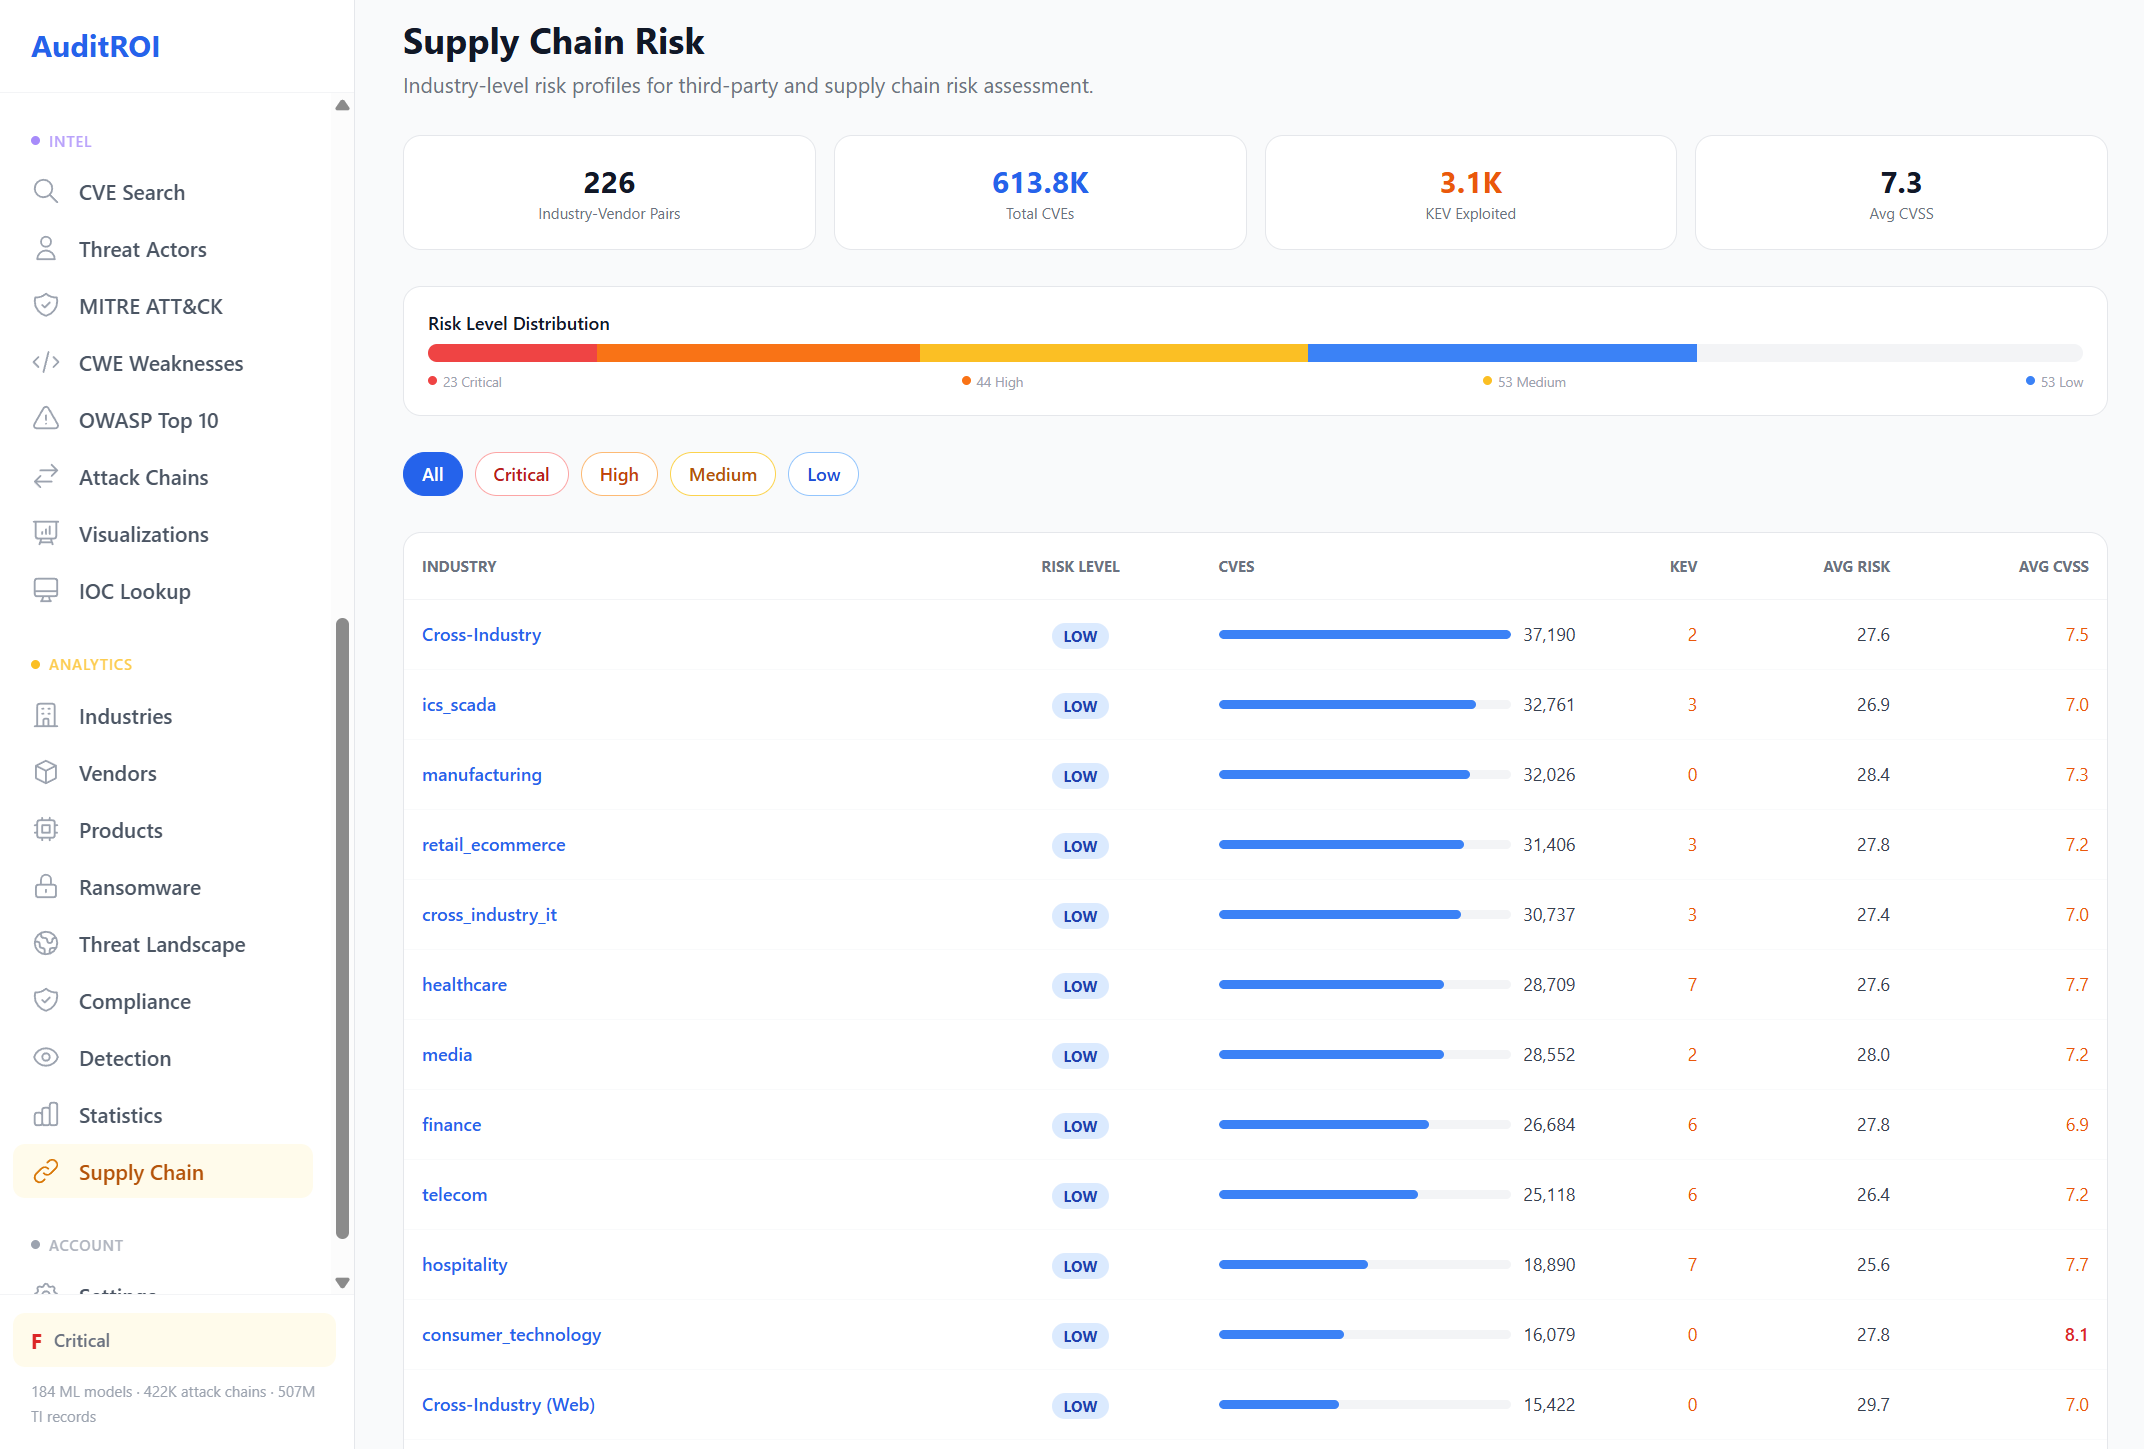
Supply Chain Risk
Industry-level risk profiles for third-party assessment. 226 vendor-industry combinations with 613.8K associated CVEs.
Each profile includes breach costs, regulatory requirements, threat actors targeting the sector, top affected vendors, and detection coverage metrics.
Example: Manufacturing supply chain with IEC 62443 compliance and APT targeting.
Explore the Full Intelligence Database
17 industries. 5,399 vendors. 15,570 products. 318 ransomware groups. All searchable, all comparable.